Lyna Cloud
Logs and observability
Follow your backend with reports on queries, the API gateway, the database, the Data API, auth, edge functions and storage, and read the logs behind them.
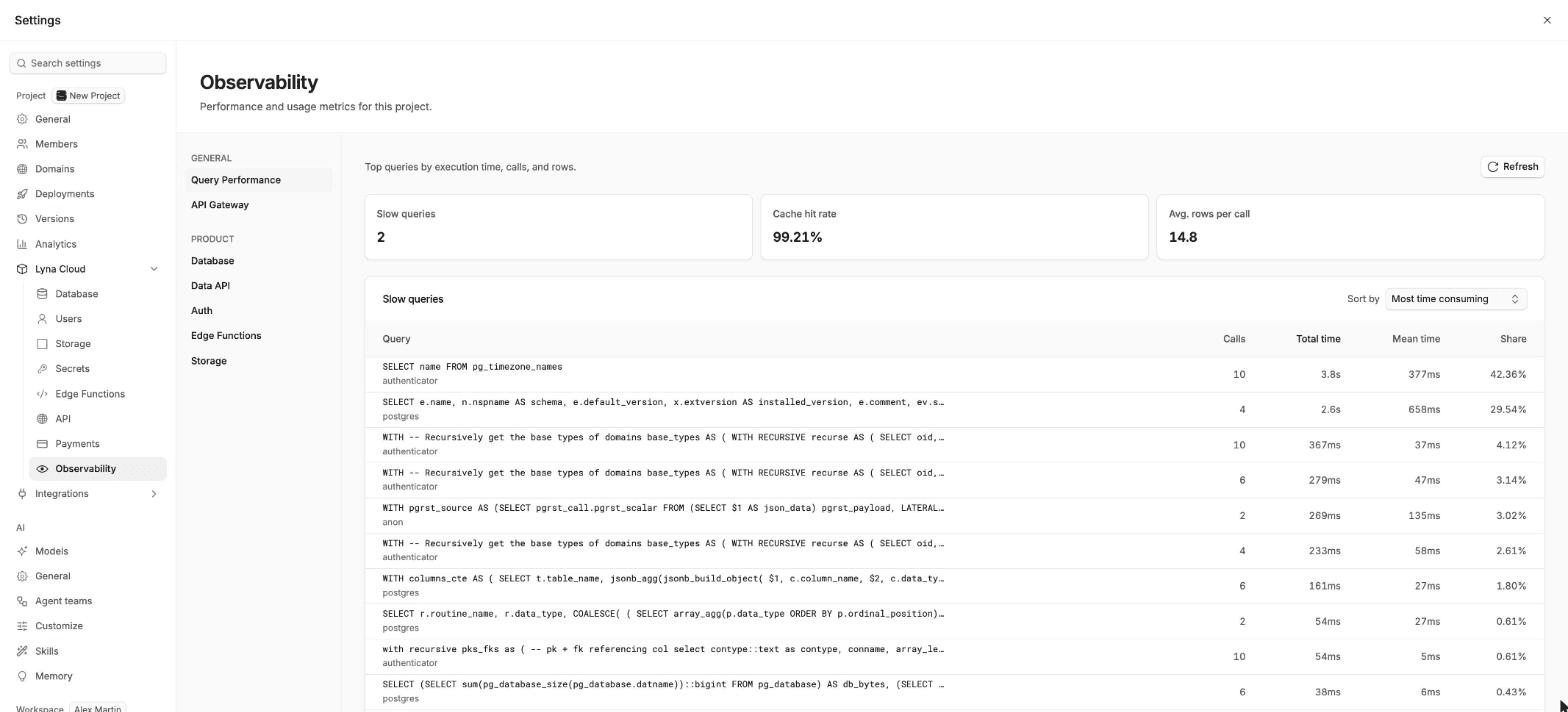
Observability shows how your backend performs: traffic, response times, slow queries and errors. Open Settings > Lyna Cloud > Observability.
What you can do
- Find the queries that use the most time.
- Watch requests, response speed and errors across your API.
- Check CPU, memory, disk and table sizes of your database.
- Follow sign-ups, sign-ins and password resets.
- See calls and execution time of your edge functions.
- Open the logs or the SQL editor from a report.
Reports
| Group | Report | What it shows |
|---|---|---|
| General | Query Performance | Top queries by execution time, calls and rows. Sort by most frequent, most time consuming or slowest. |
| General | API Gateway | Request volume, response speed (p50, p95, p99), status codes, network traffic, requests by country, and the busiest, slowest and failing routes. |
| Product | Database | CPU, memory, disk IOPS, table sizes and long-running queries. |
| Product | Data API | REST request volume and status codes. |
| Product | Auth | Sign-ups, sign-ins and password resets. |
| Product | Edge Functions | Invocations, status codes and execution time per function. |
| Product | Storage | Cache hit rate, total requests and response speed. |
Pick a Time range from the last 10 minutes to the last 28 days. On charts, drag across a range to zoom in. Some reports let you filter by path, method, status code or user agent.
From a report to the cause
- Open a query in Query Performance to see its pattern, calls, times and cache hit rate. Choose Explain with AI to ask the chat why it is slow, or Open in SQL editor.
- Choose Open in logs to read the database logs for the same time window.
New data can take a few minutes to appear, and auth usage up to 24 hours. A report marked Partial data could not load every metric.
Other logs in Lyna
| Logs | Where |
|---|---|
| Database, API, auth, storage and realtime logs | Database > Logs |
| One edge function's logs and requests | Edge functions |
| Build logs of a publish | Deployments |
| Your app's console and network while you build | Devtools |
Plan
Observability is a Pro feature. On Free, the page shows what it offers and an Upgrade to Pro button.