DevTools
Lyna has a built-in DevTools panel at the bottom of the editor. Eight tabs give you the same debugging tools you'd use in Chrome, but scoped to your sandboxed app. No need to open a separate browser window.
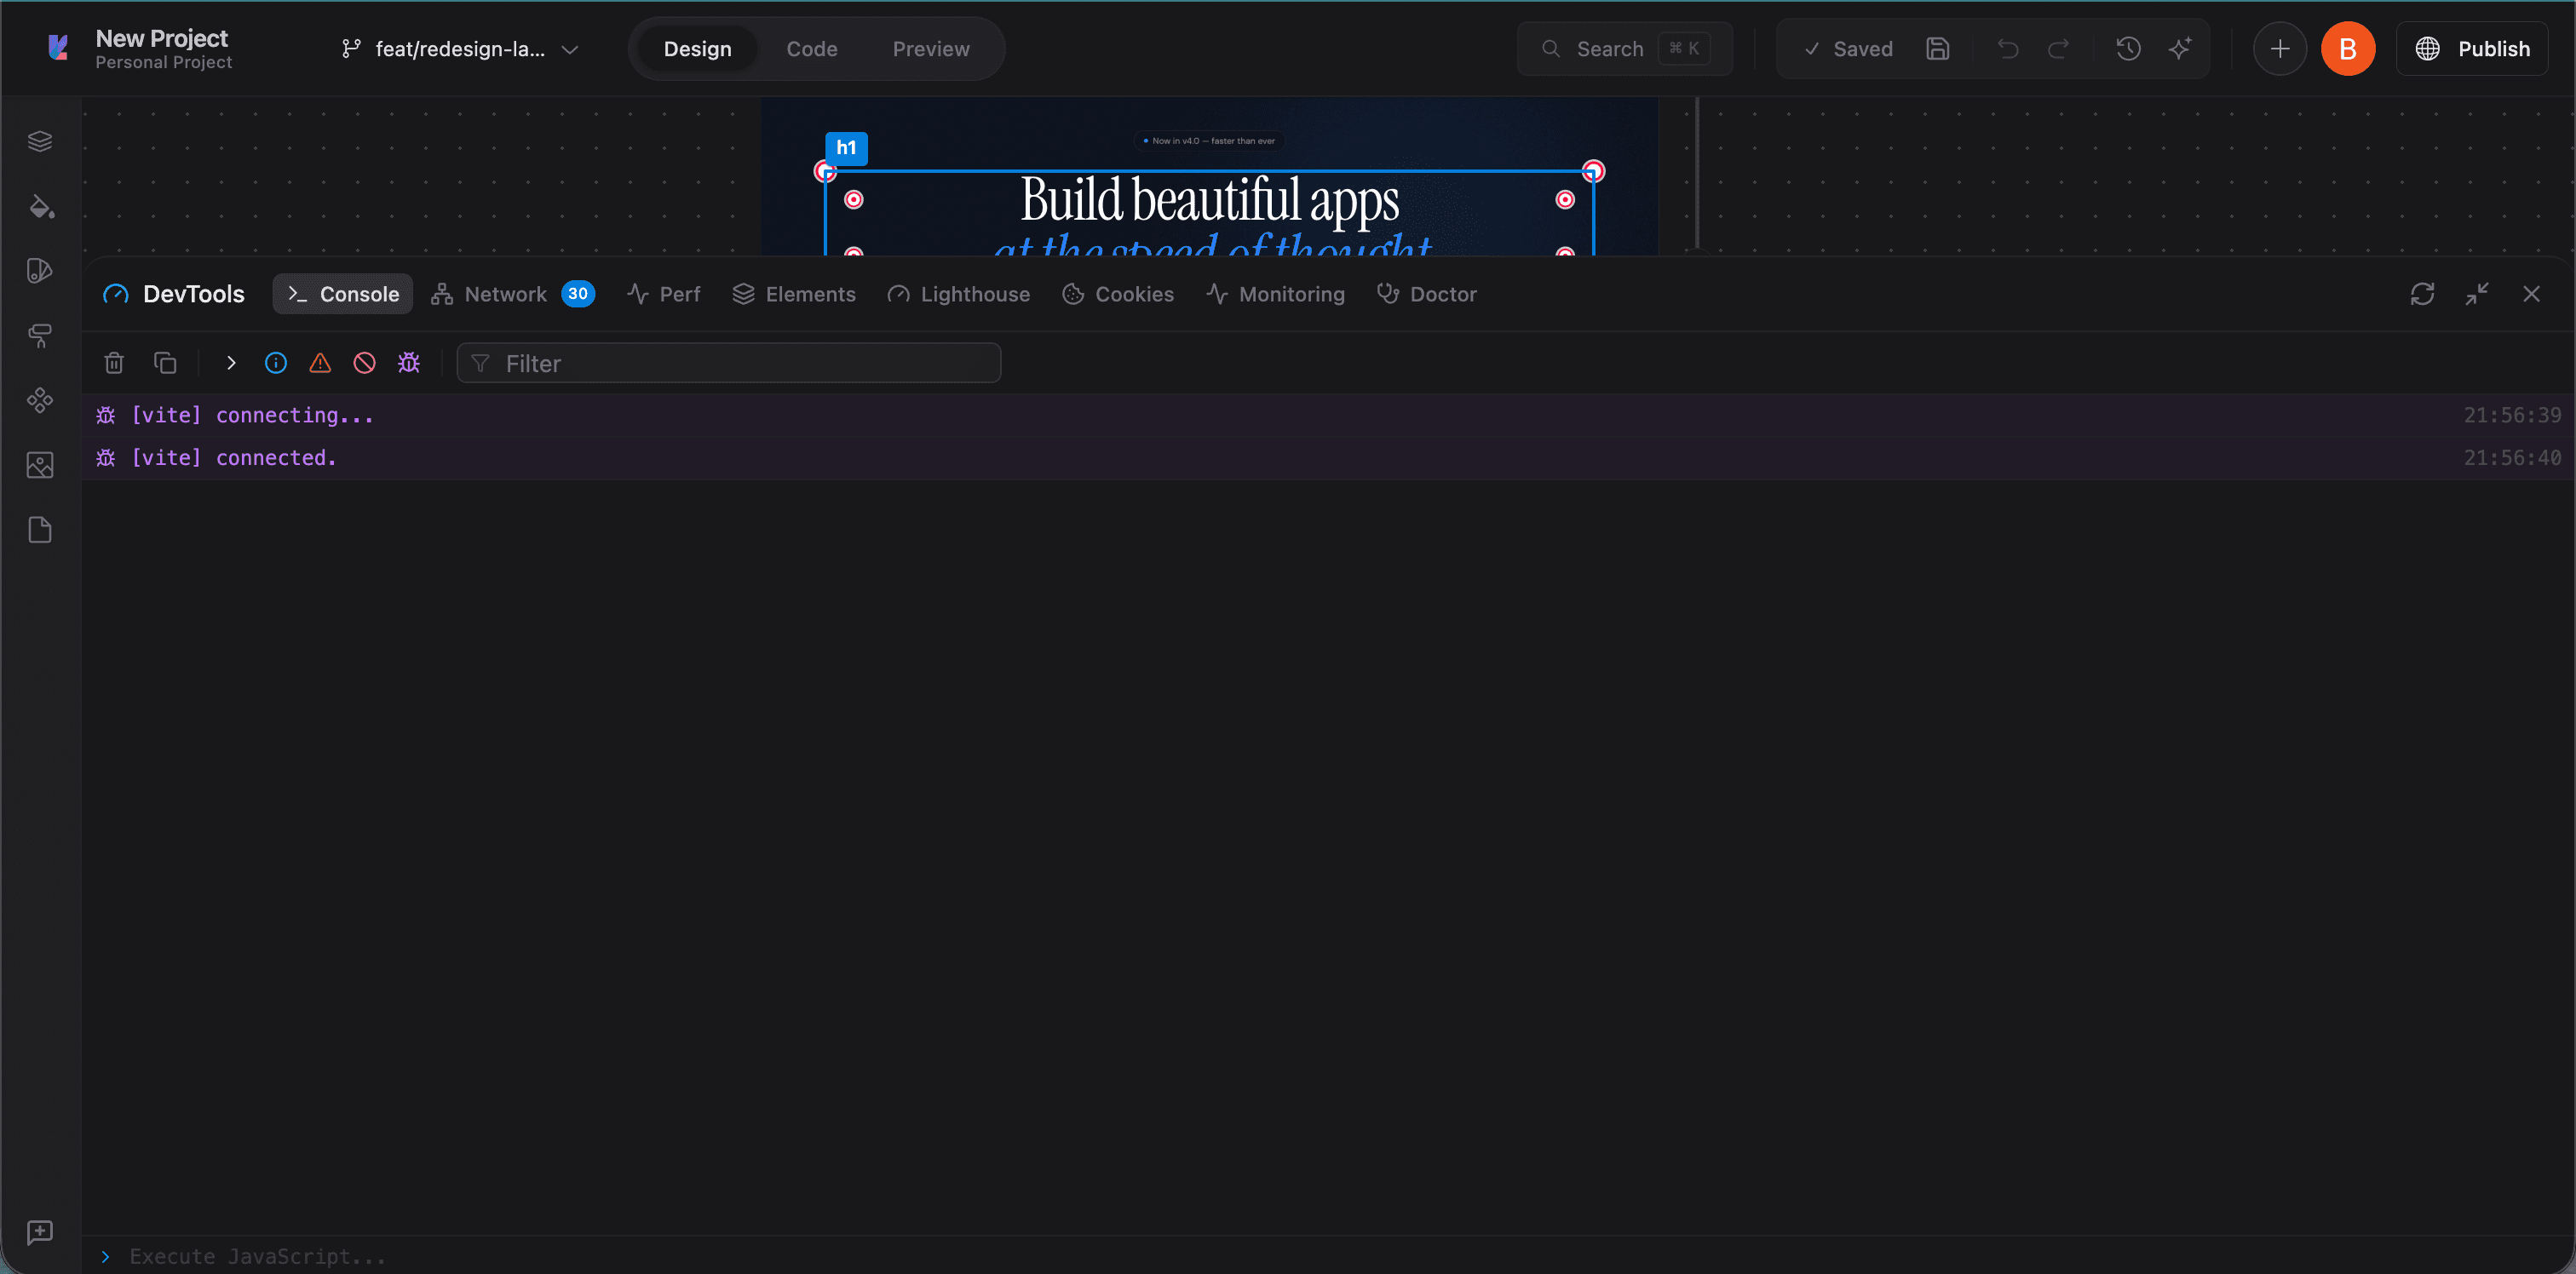
Console
Standard browser console. View logs, warnings, errors, and run JavaScript directly against your app. Filter by log level, search output, and clear logs. Vite HMR messages show up here too.
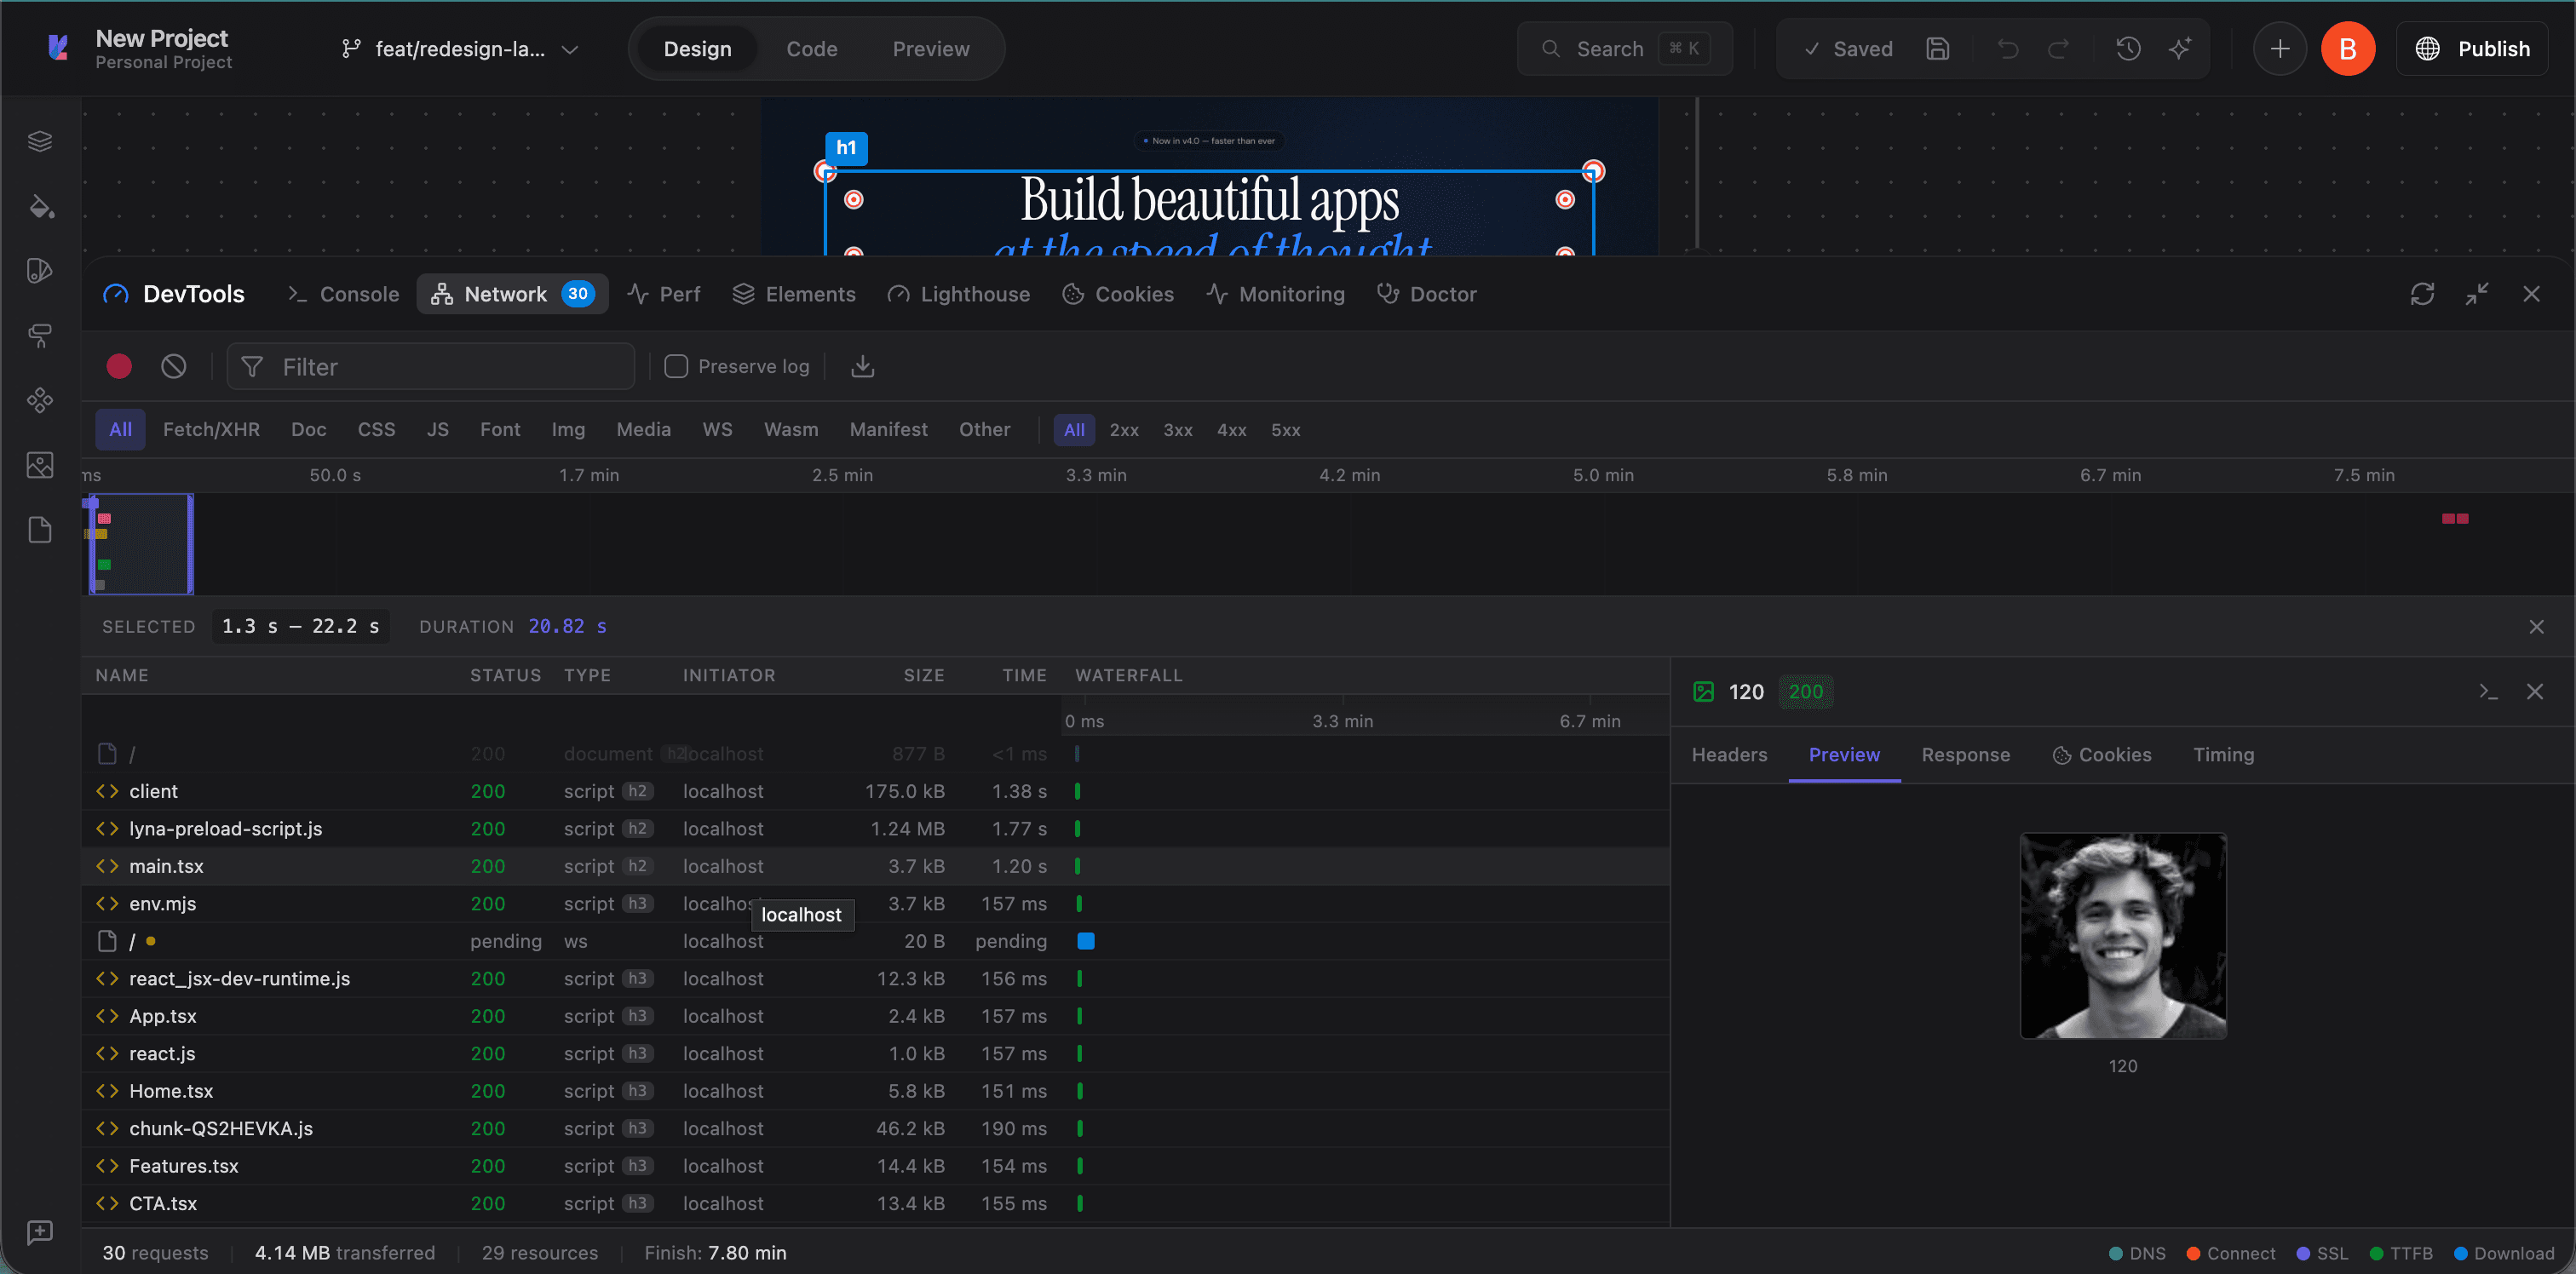
Network
Monitor all HTTP requests from your app. Filter by type (Fetch/XHR, Doc, CSS, JS, Font, Img, Media, WS), view headers, preview responses, and check timing.
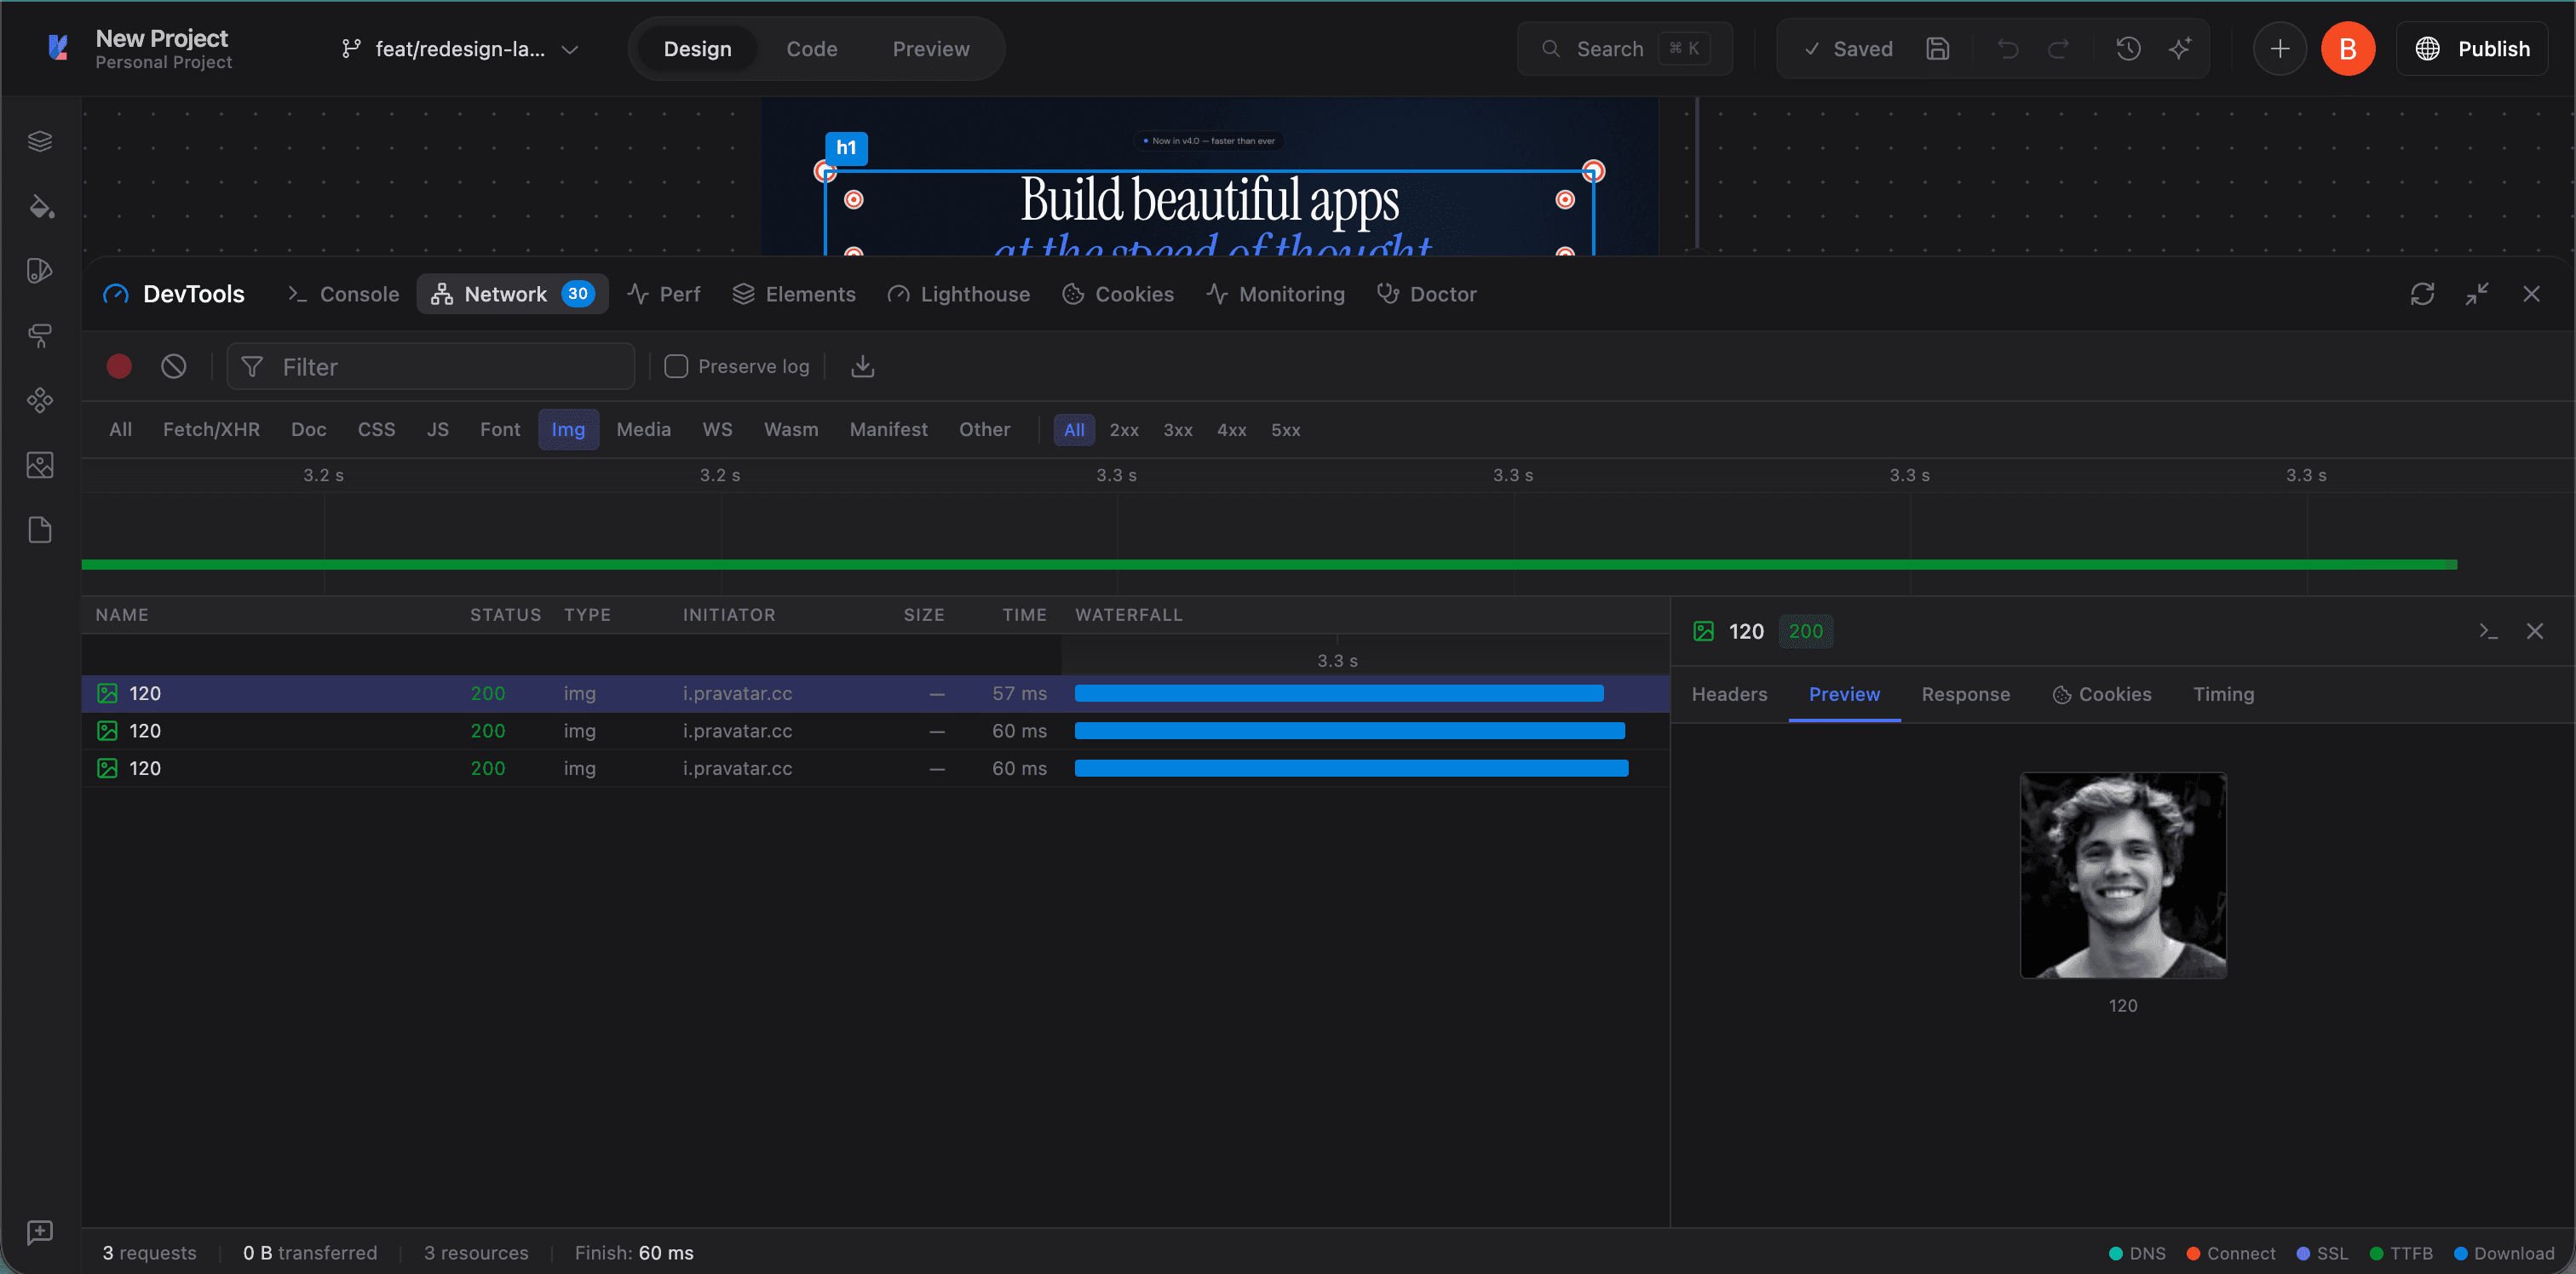
Click any request to see its headers, preview, response body, cookies, and timing breakdown.
Perf
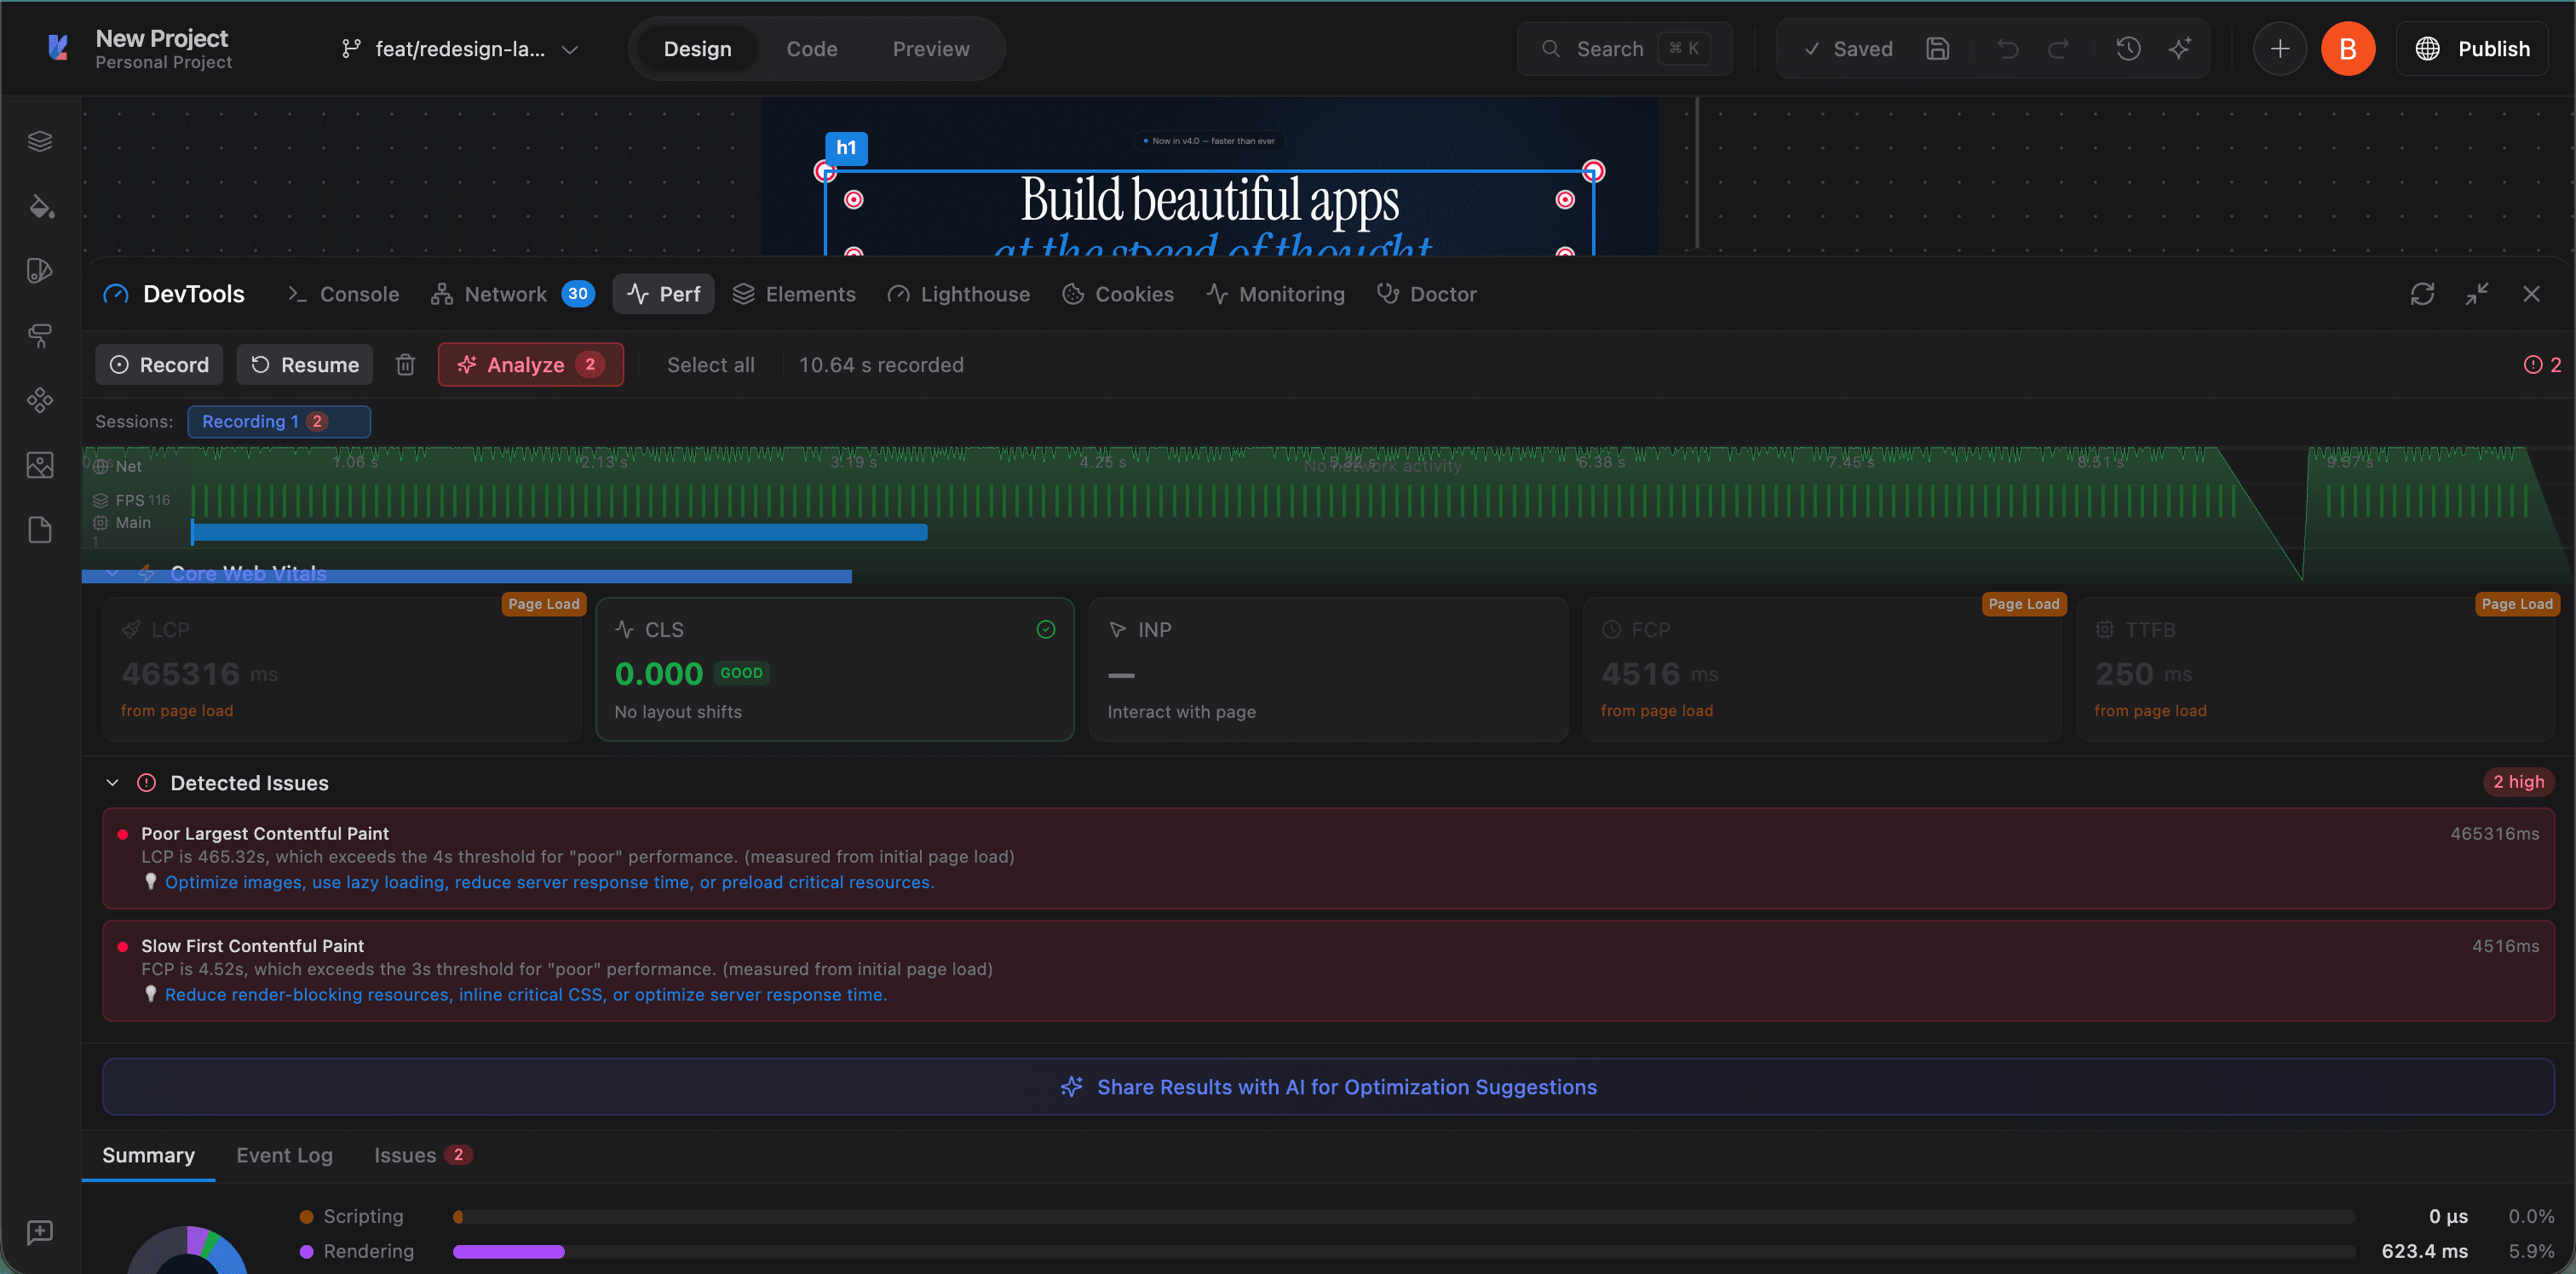
Record and analyze runtime performance. See Core Web Vitals (LCP, CLS, INP, FCP, TTFB), FPS graphs, and a breakdown of scripting, rendering, painting, and loading time.
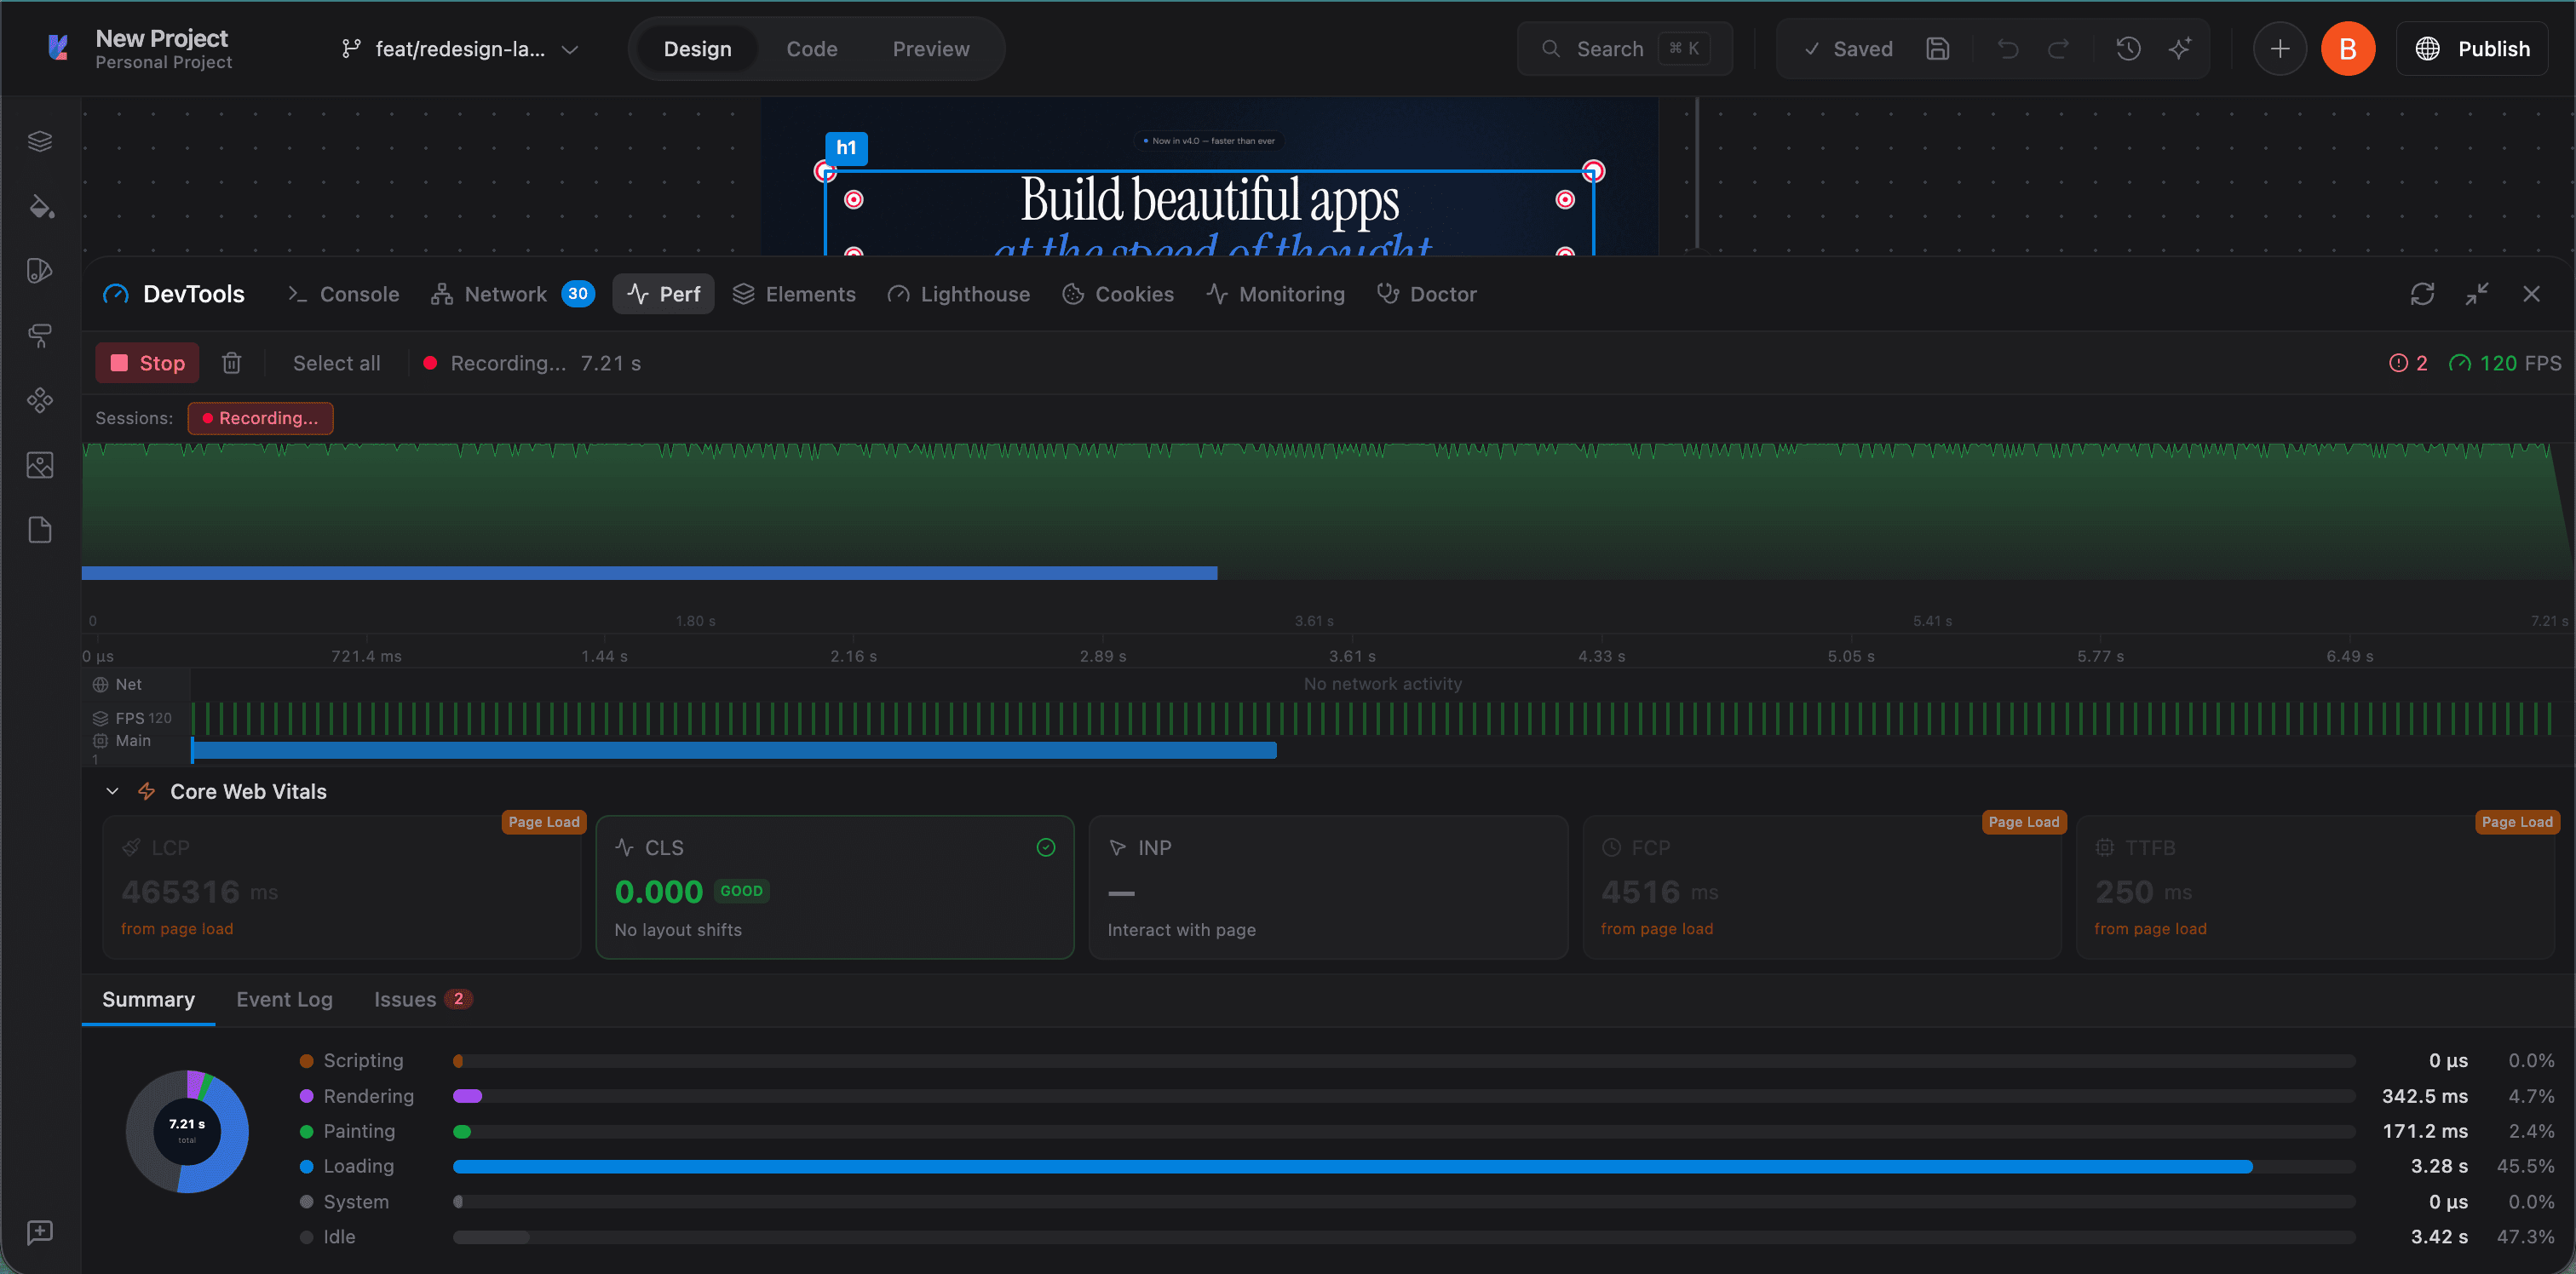
After recording, the Analyze button highlights detected issues with specific recommendations. You can share results with AI for optimization suggestions.
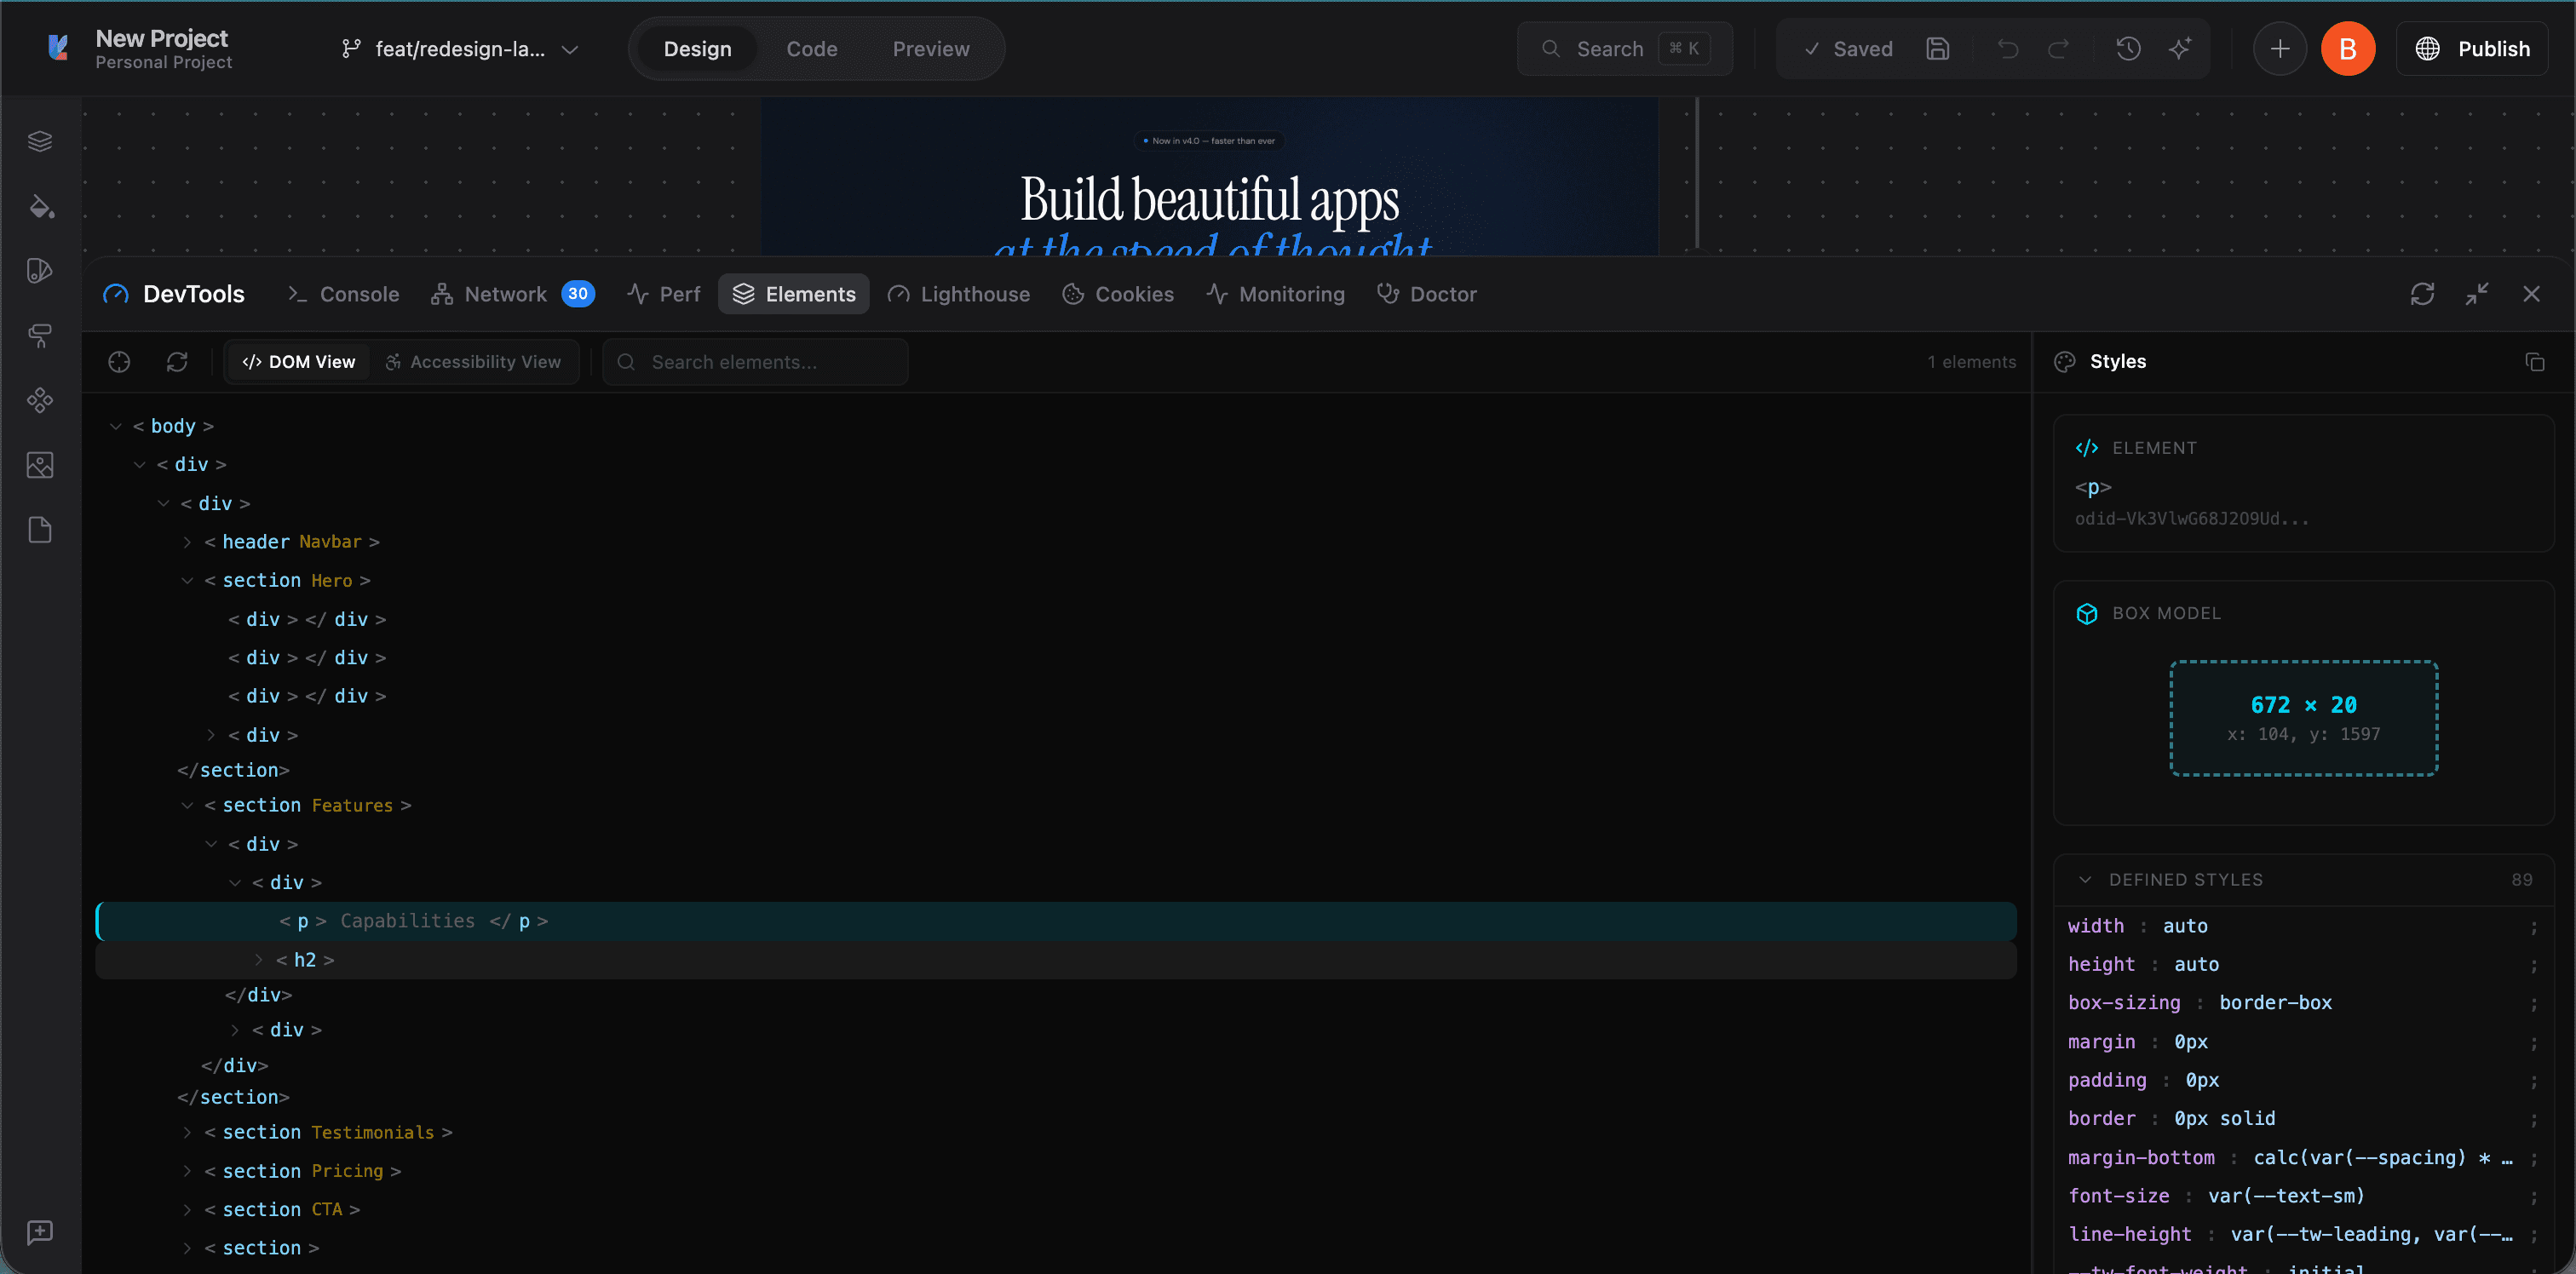
Elements
Inspect the DOM tree of your running app. Switch between DOM View and Accessibility View. Select any element to see its computed styles, box model dimensions, and all applied CSS properties.
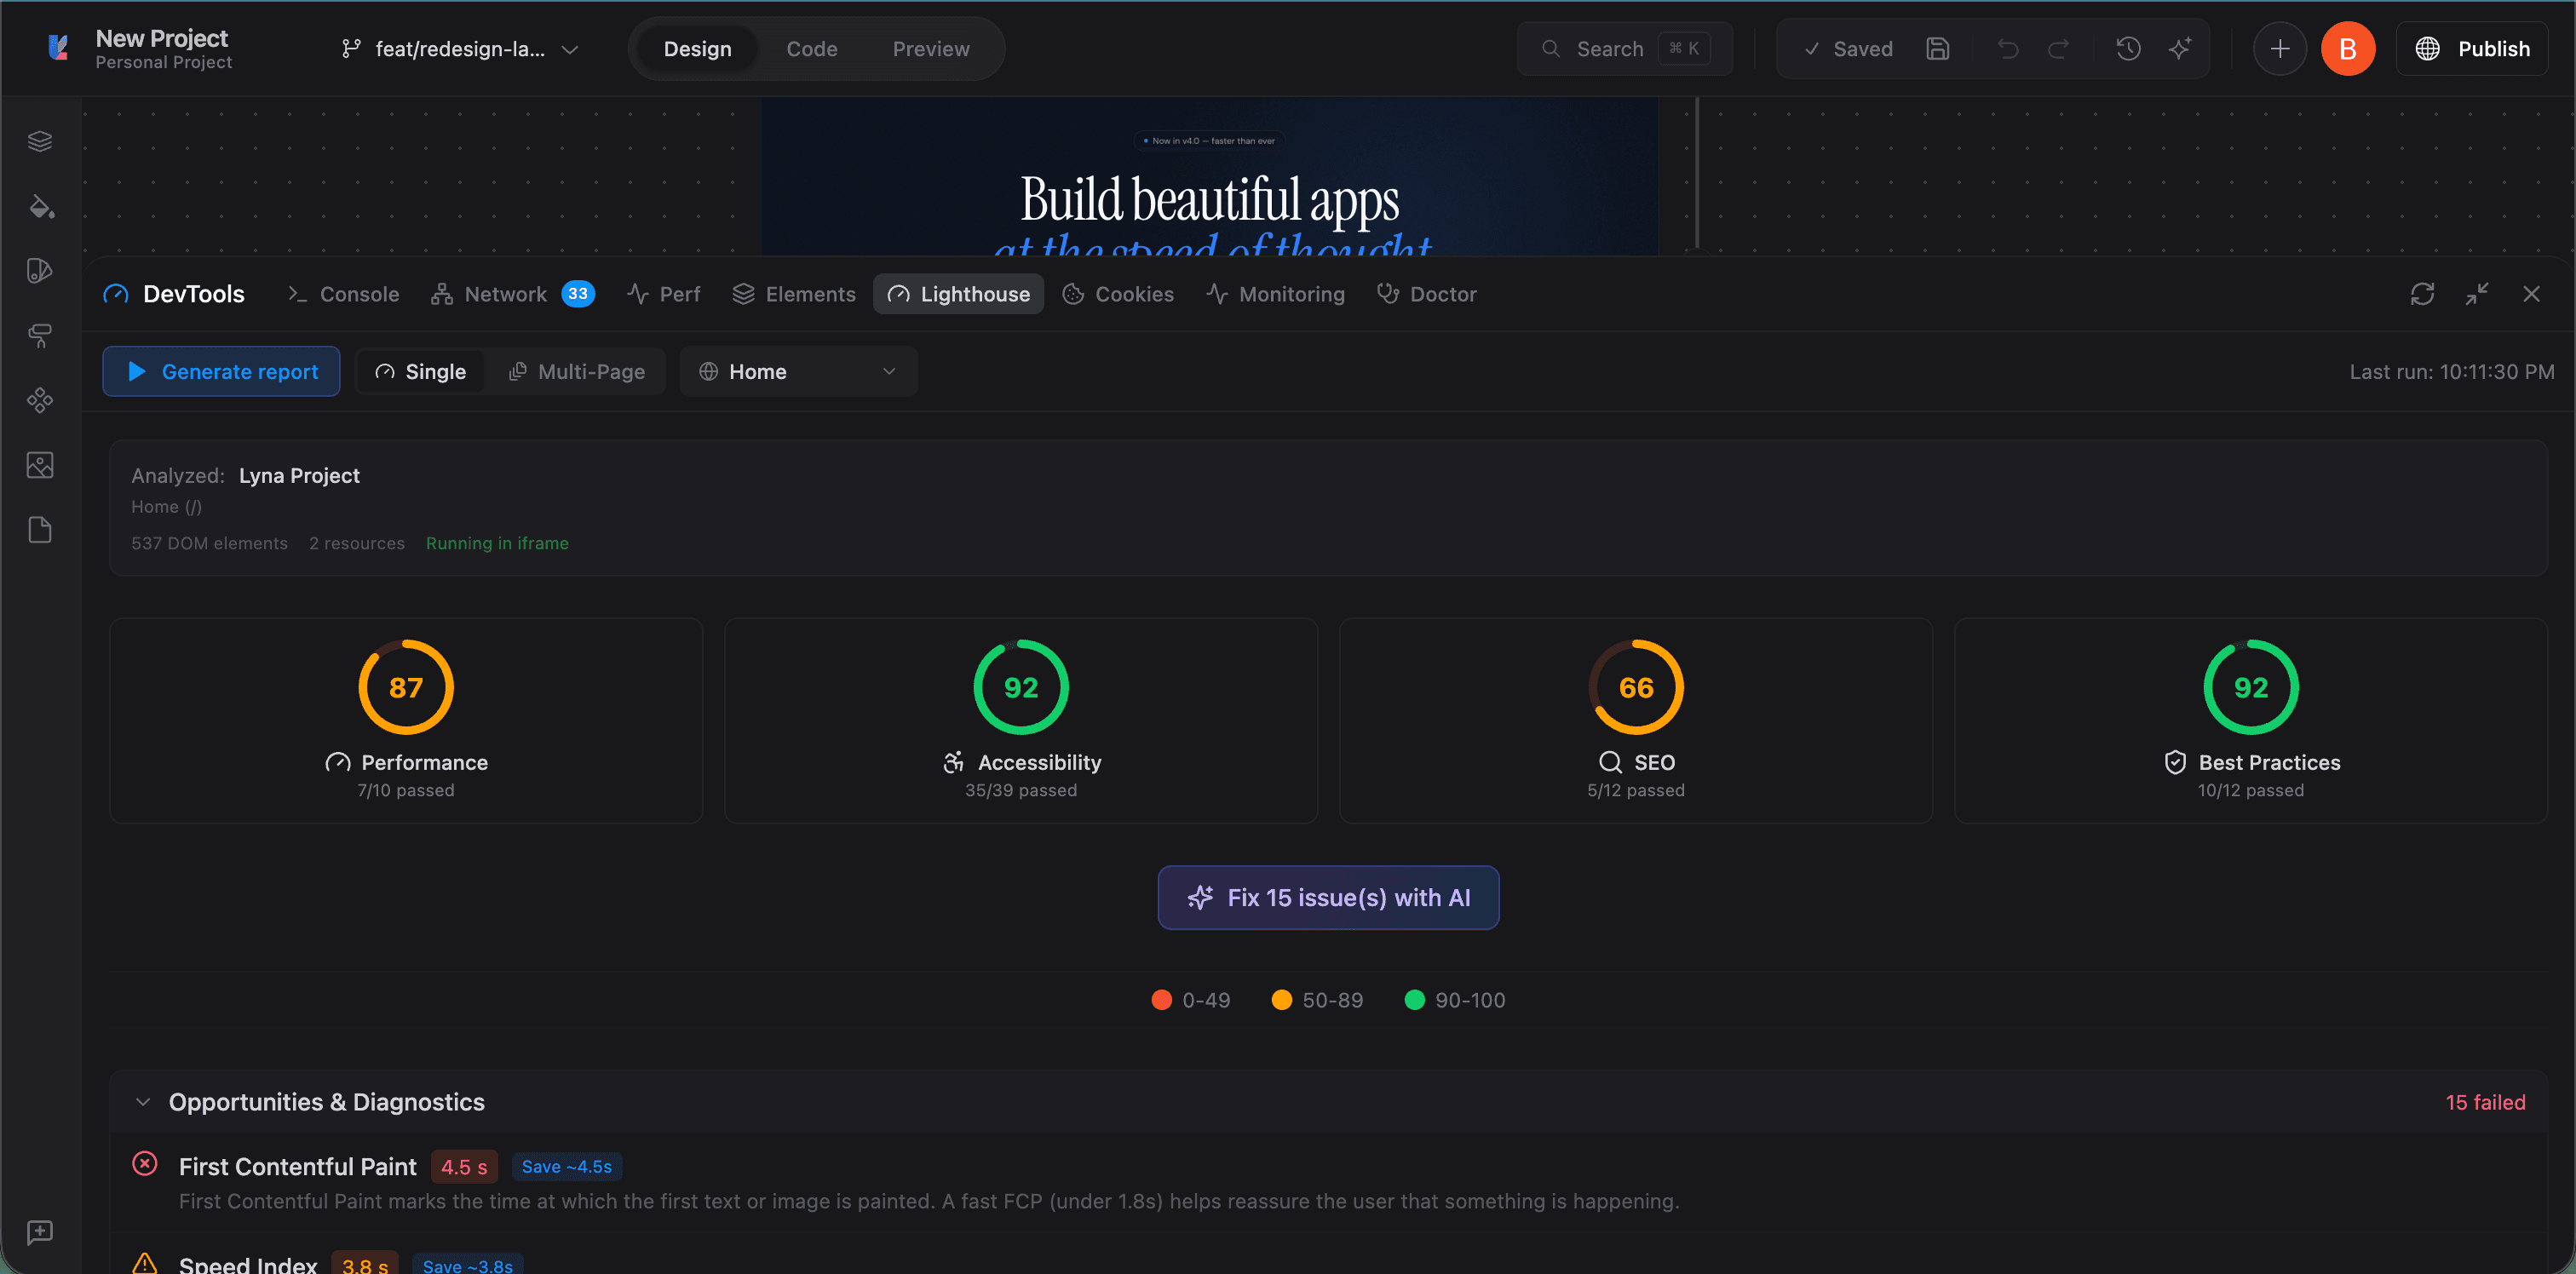
Lighthouse
Run Lighthouse audits directly in the editor. Choose between Single page or Multi-Page analysis. Get scores for Performance, Accessibility, SEO, and Best Practices.
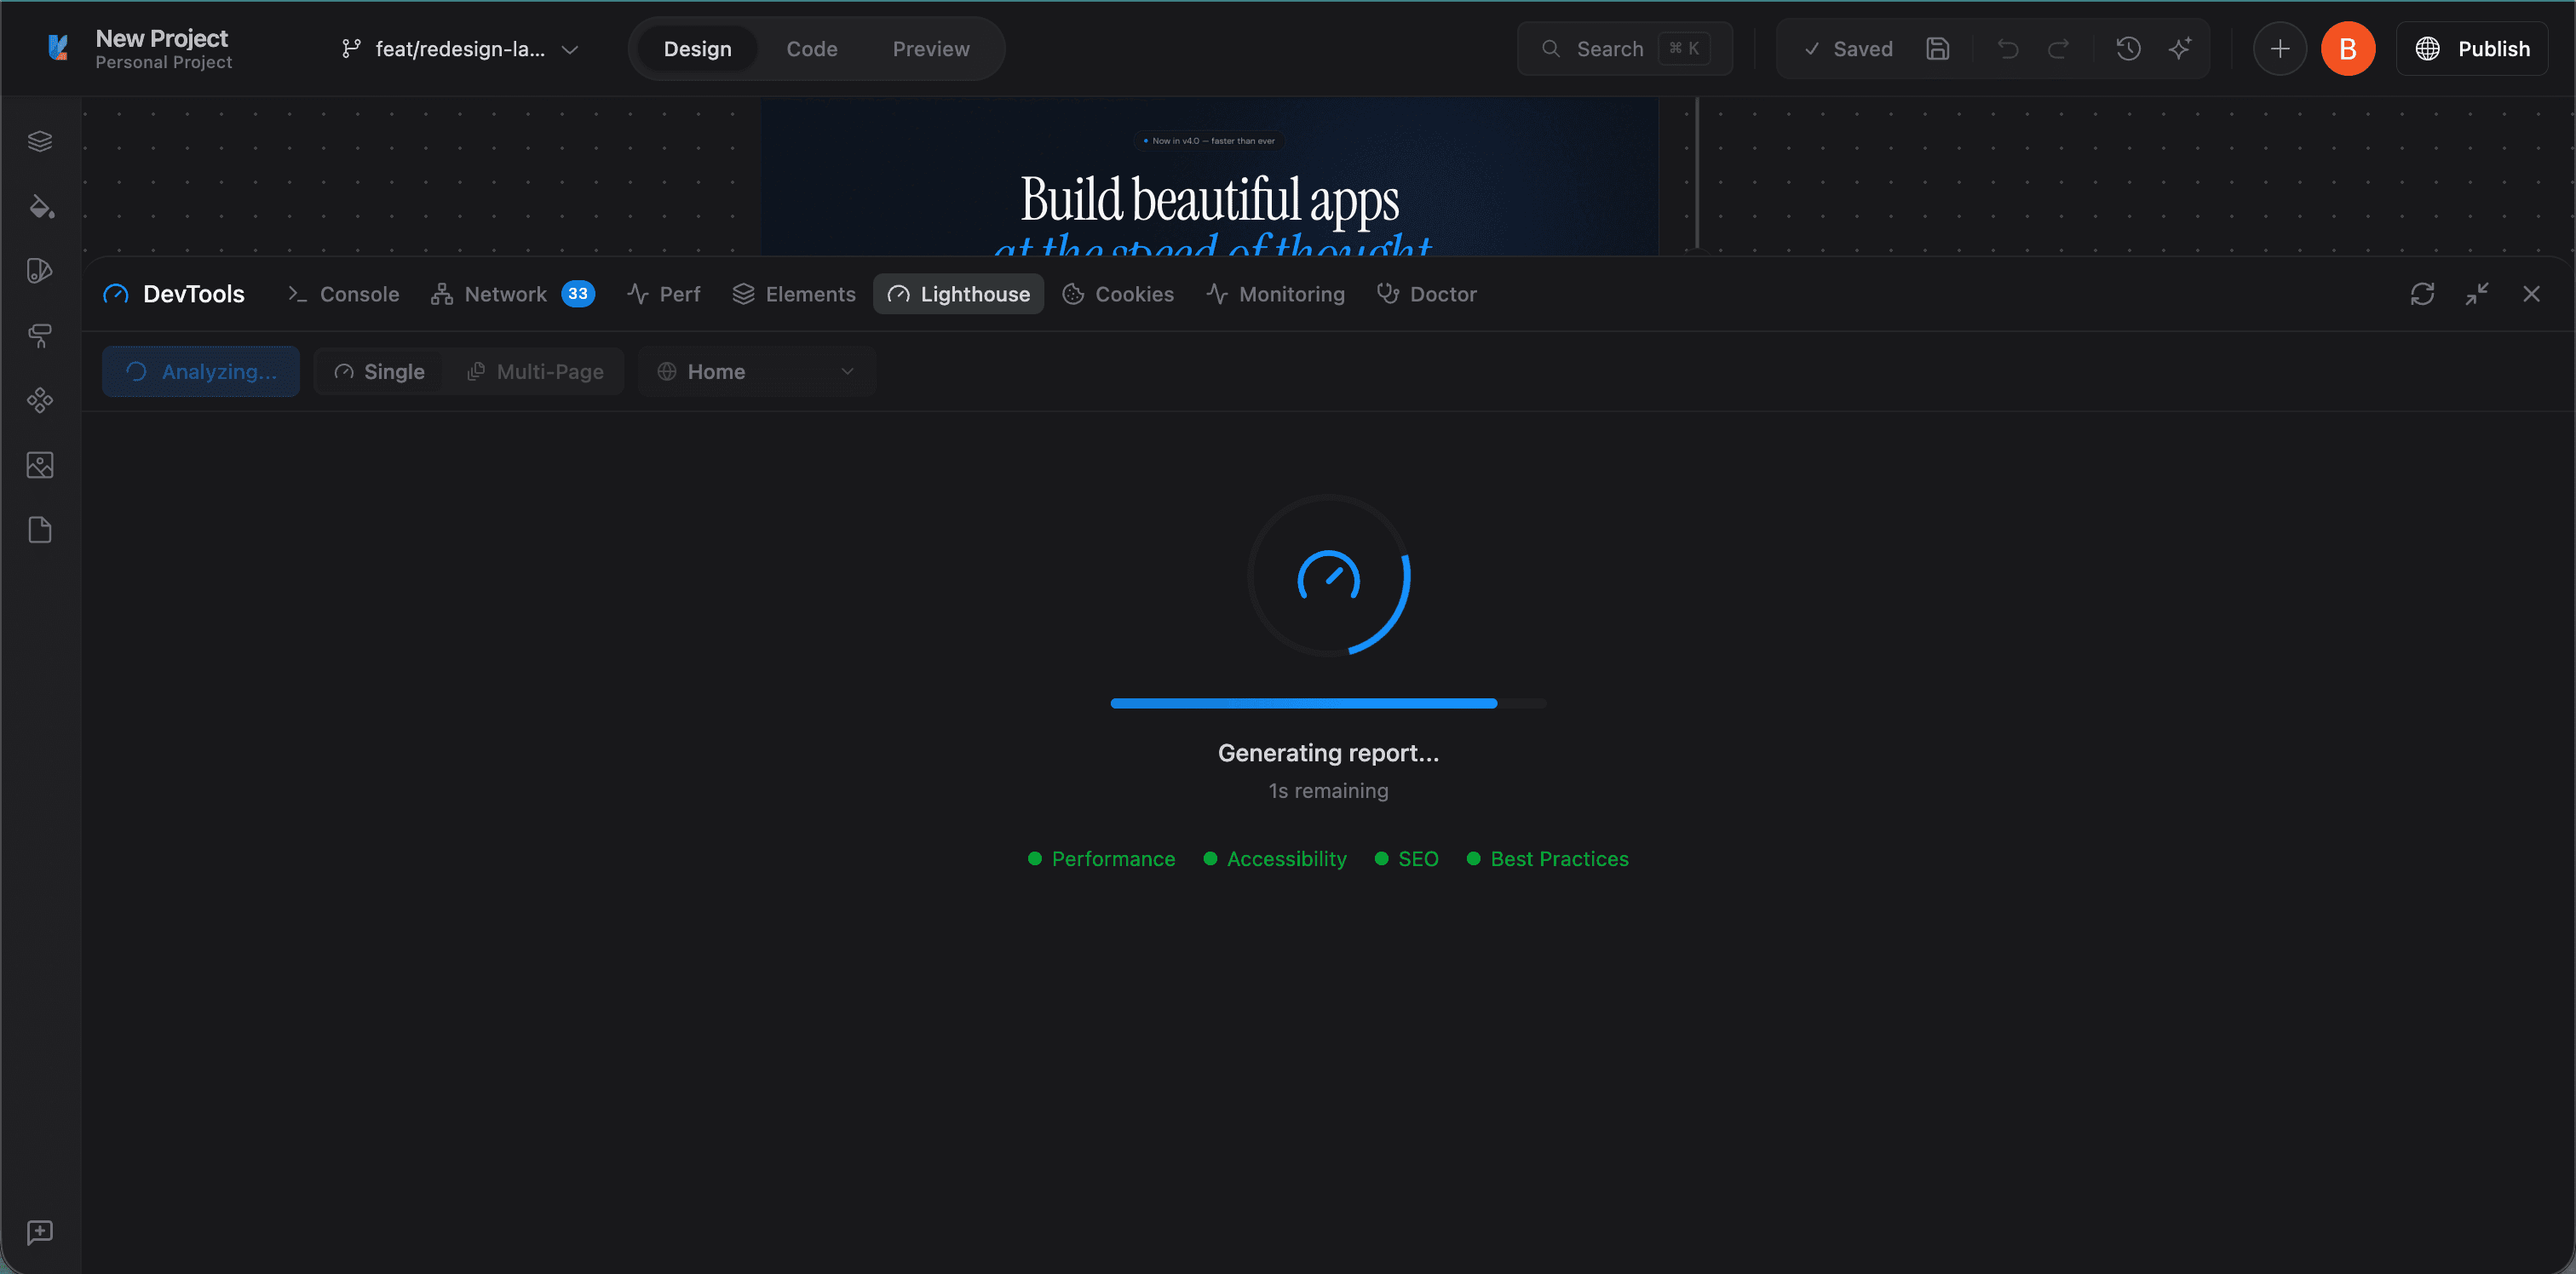
Results include an "Opportunities & Diagnostics" section with actionable fixes. Click "Fix issues with AI" to send the results to the AI chat for automatic fixes.
Cookies
View and manage cookies, localStorage, and sessionStorage from the sandboxed preview. Filter by storage type and inspect individual values.
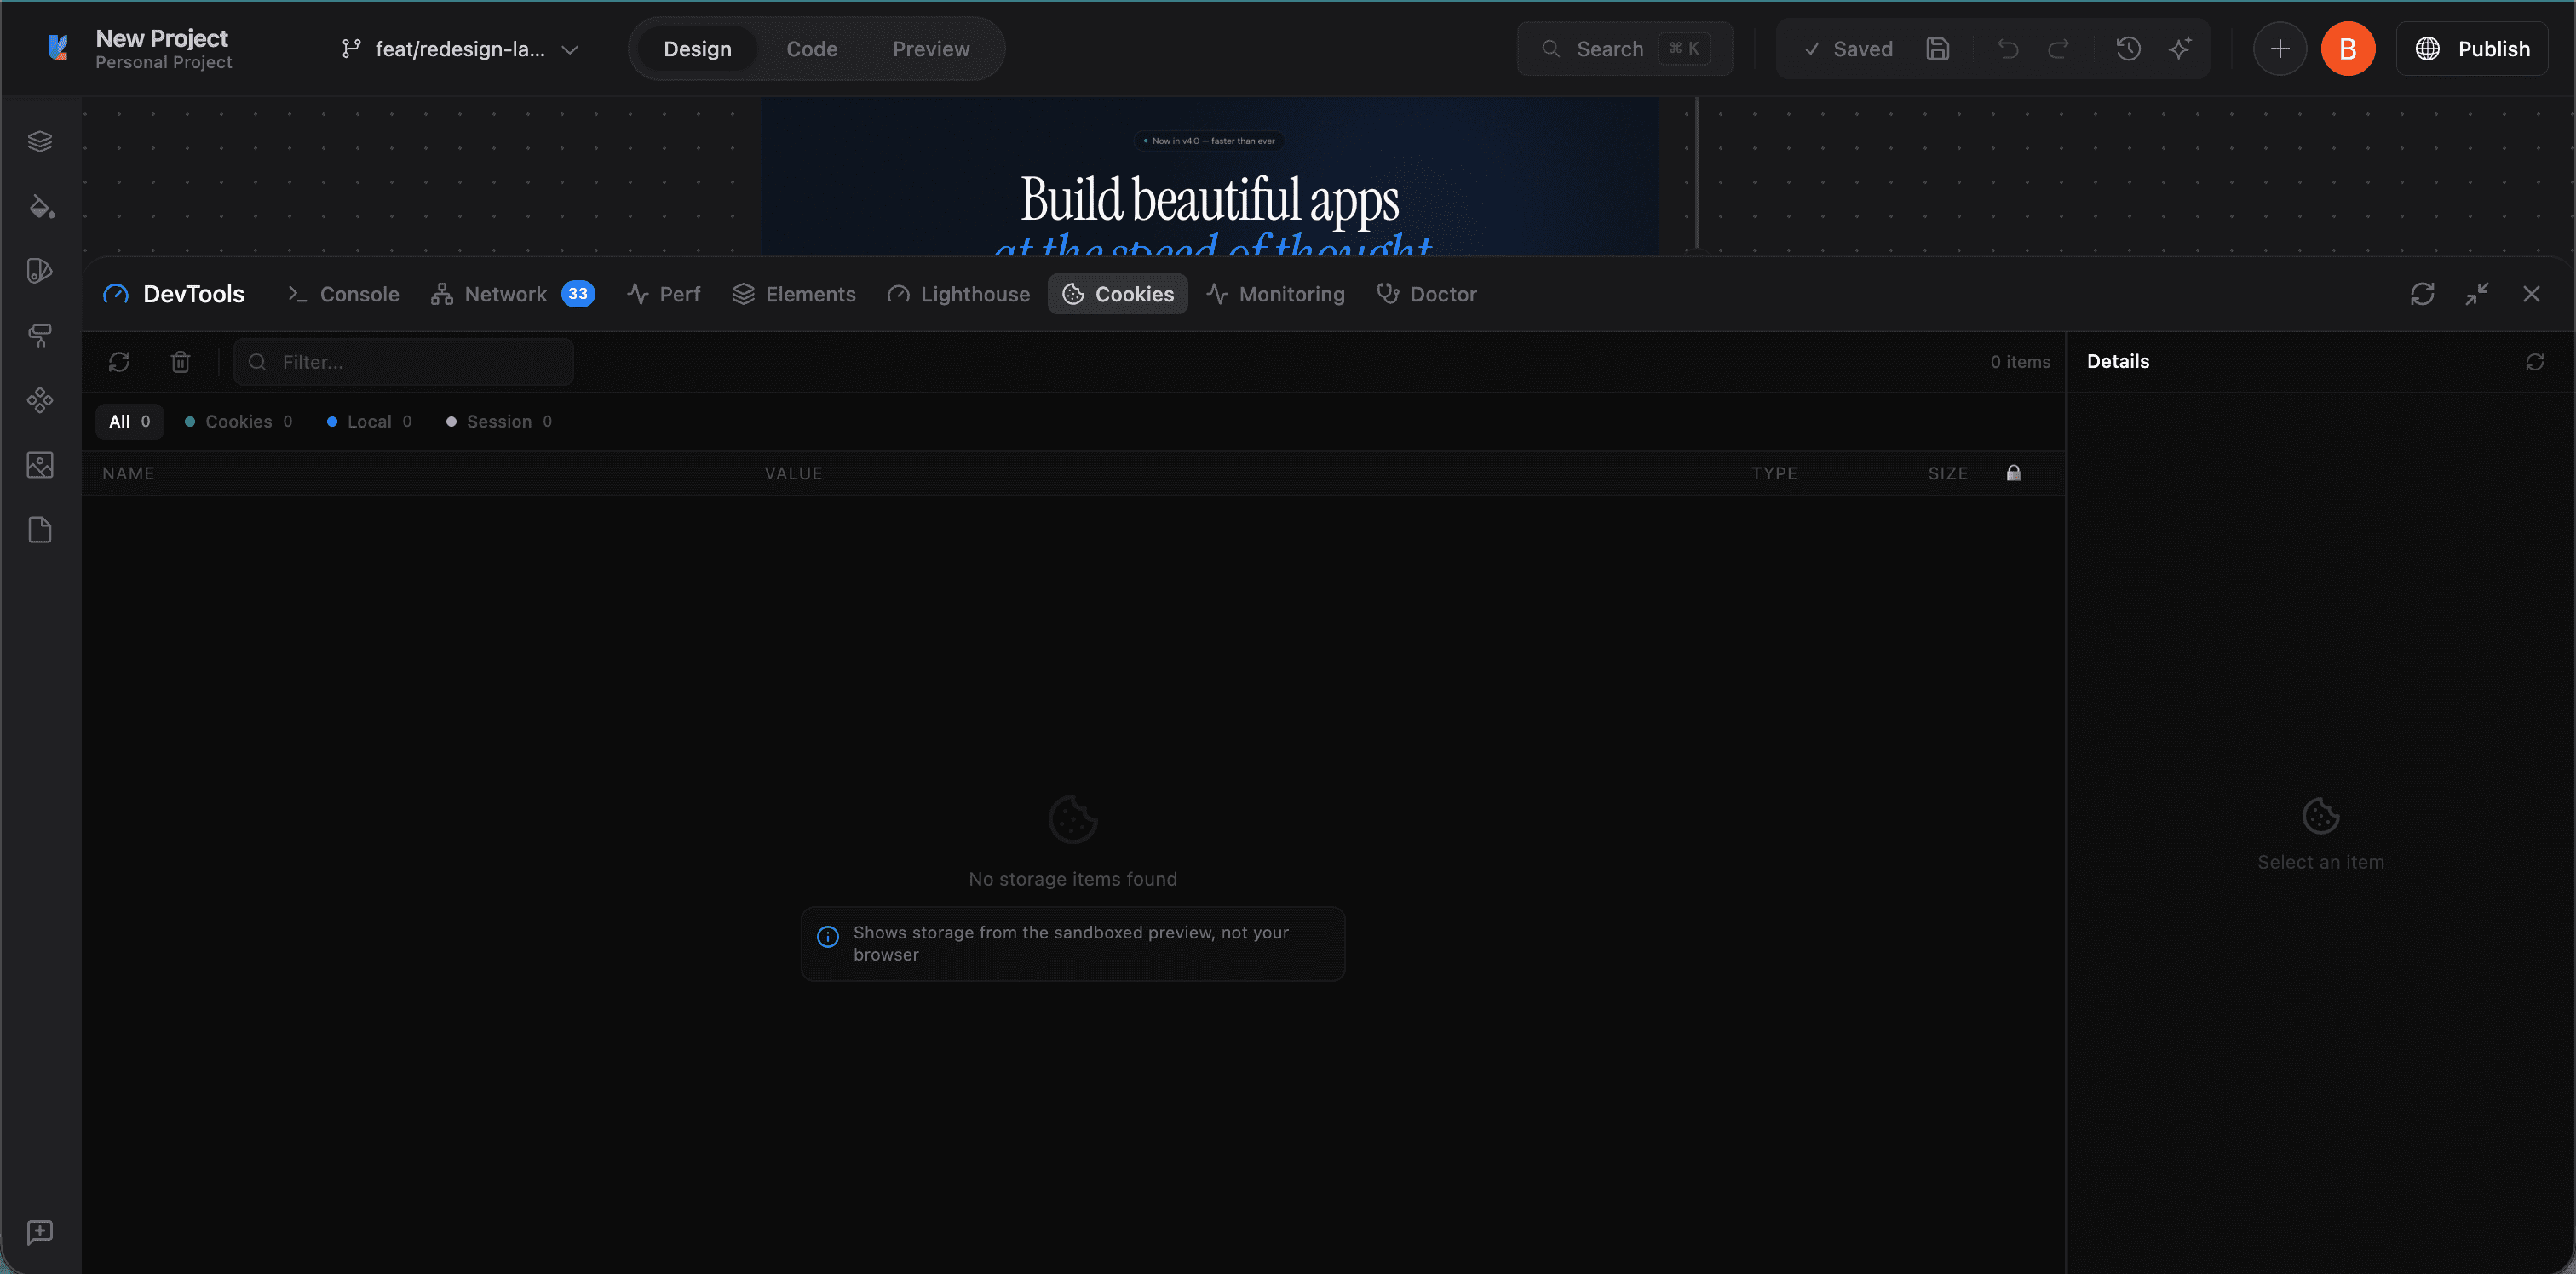
Note: this shows storage from the sandboxed preview, not your local browser.
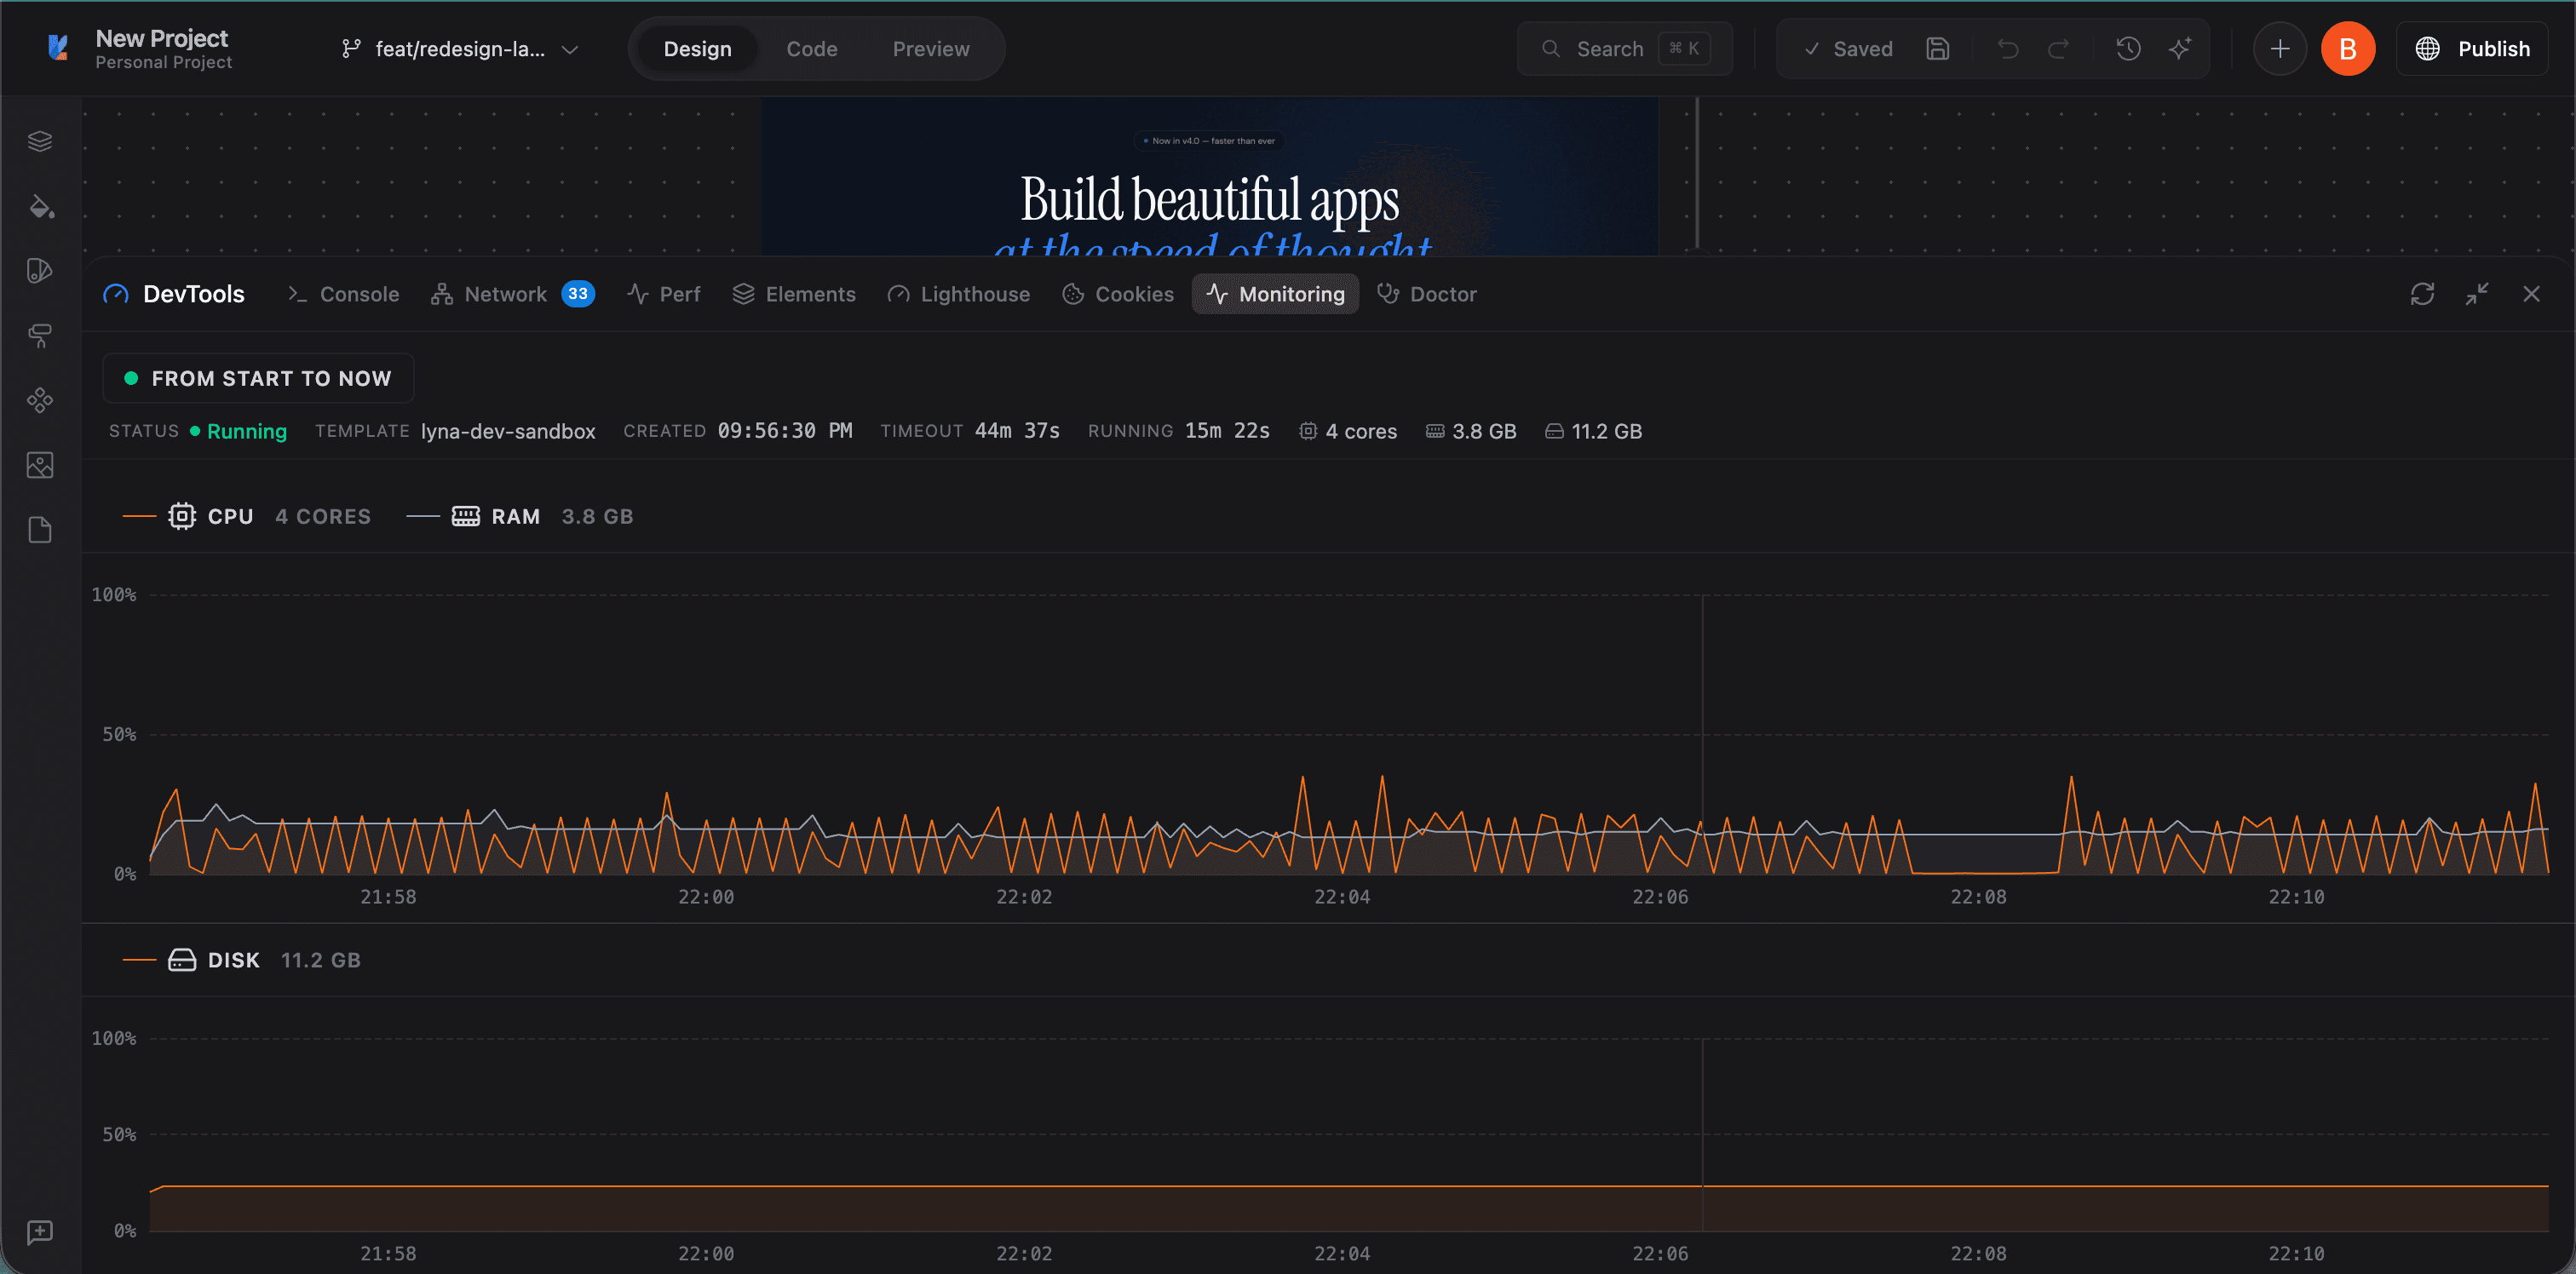
Monitoring
Live resource monitoring for your sandbox environment. Track CPU usage, RAM consumption, and disk space in real time. Shows sandbox status, template, creation time, timeout, and hardware specs.
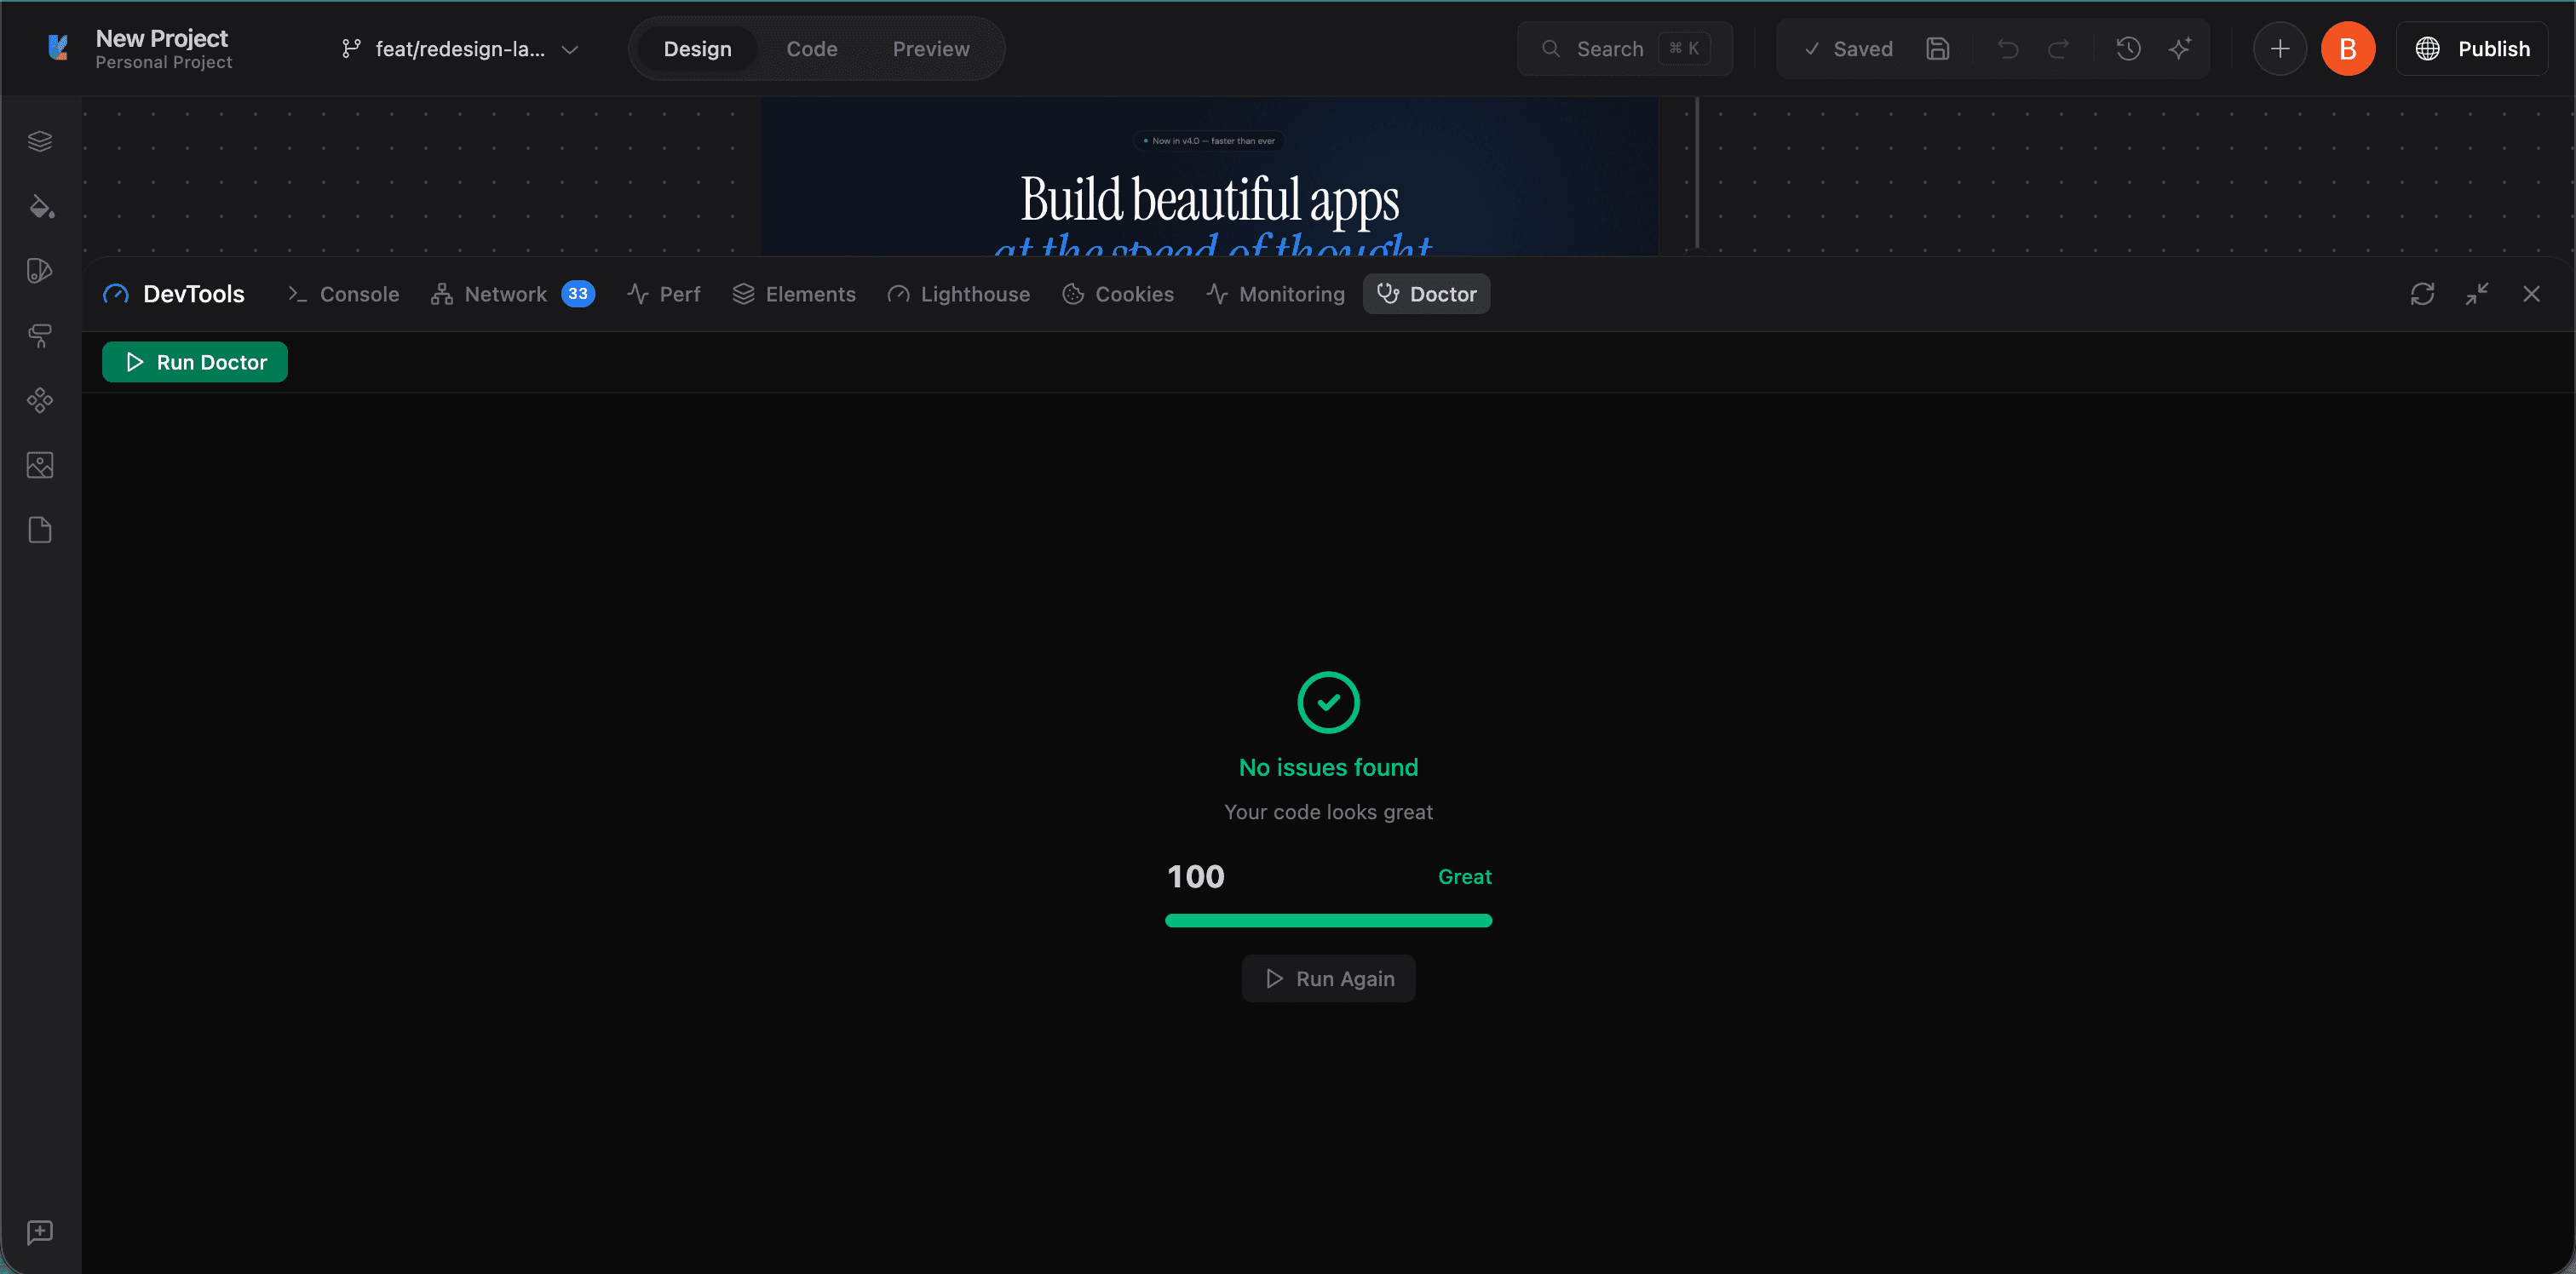
Doctor
Runs a health check on your project's code quality. Click "Run Doctor" to scan for issues. A score of 100 means no problems found.